Stock Market Outlook for March 19, 2026

Inflation hedges continue to add alpha to portfolios, but we continue to seek an opportunity to rotate to higher yielding assets when the timing is appropriate.
*** Stocks highlighted are for information purposes only and should not be considered as advice to purchase or to sell mentioned securities. As always, the use of technical and fundamental analysis is encouraged in order to fine tune entry and exit points to average seasonal trends.
Stocks Entering Period of Seasonal Strength Today:
Subscribers Click on the relevant link to view the full profile. Not a subscriber? Signup here.

CenterPoint Energy, Inc. (NYSE:CNP) Seasonal Chart
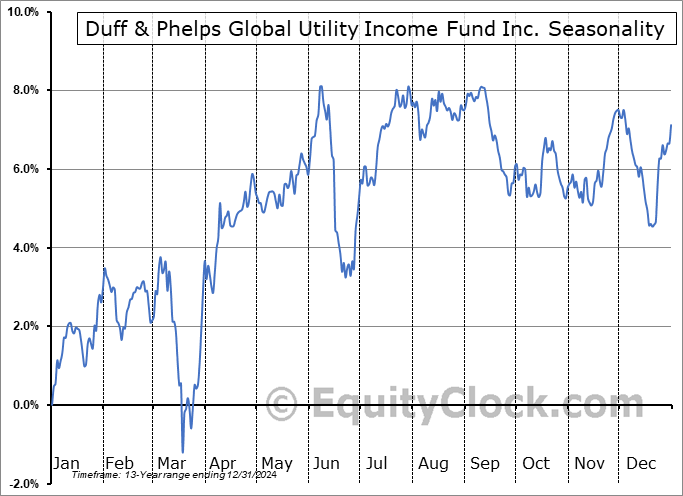
Duff & Phelps Global Utility Income Fund Inc. (NYSE:DPG) Seasonal Chart
Disclaimer: Comments and opinions offered in this report are for information only. They should not be considered as advice to purchase or to sell mentioned securities. Data offered is believed to be accurate, but is not guaranteed.
The Markets
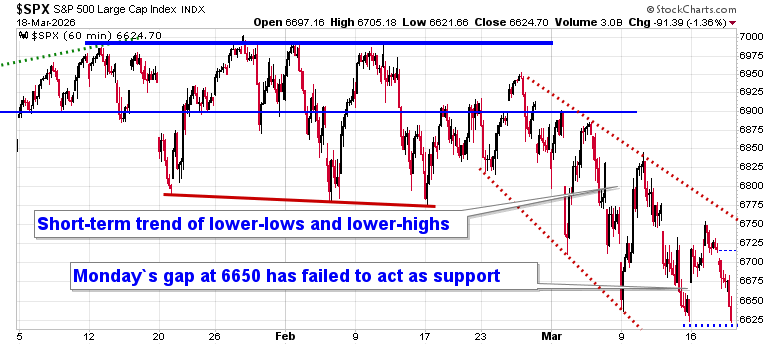
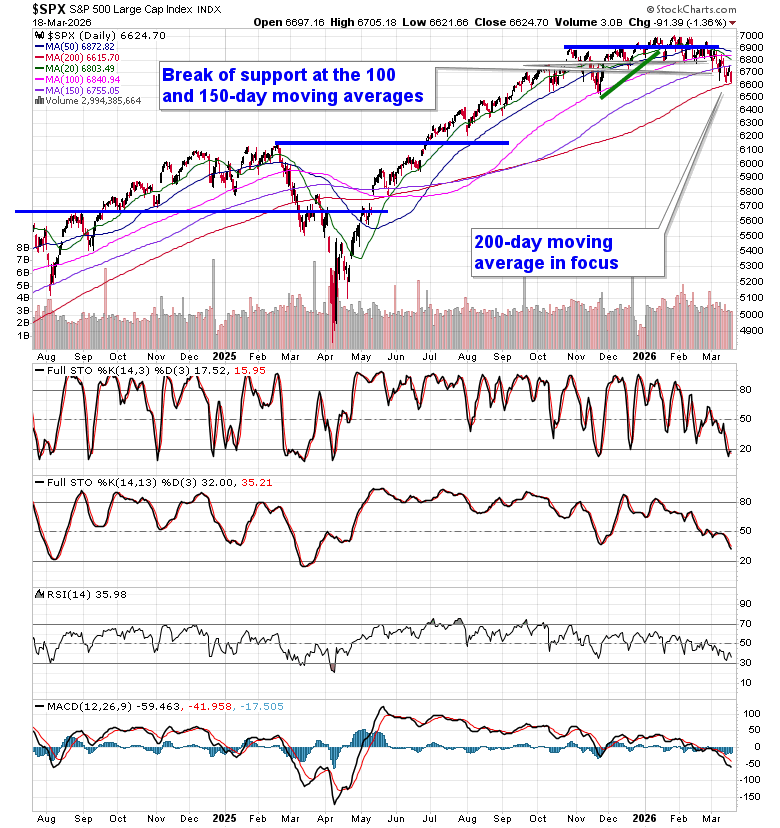
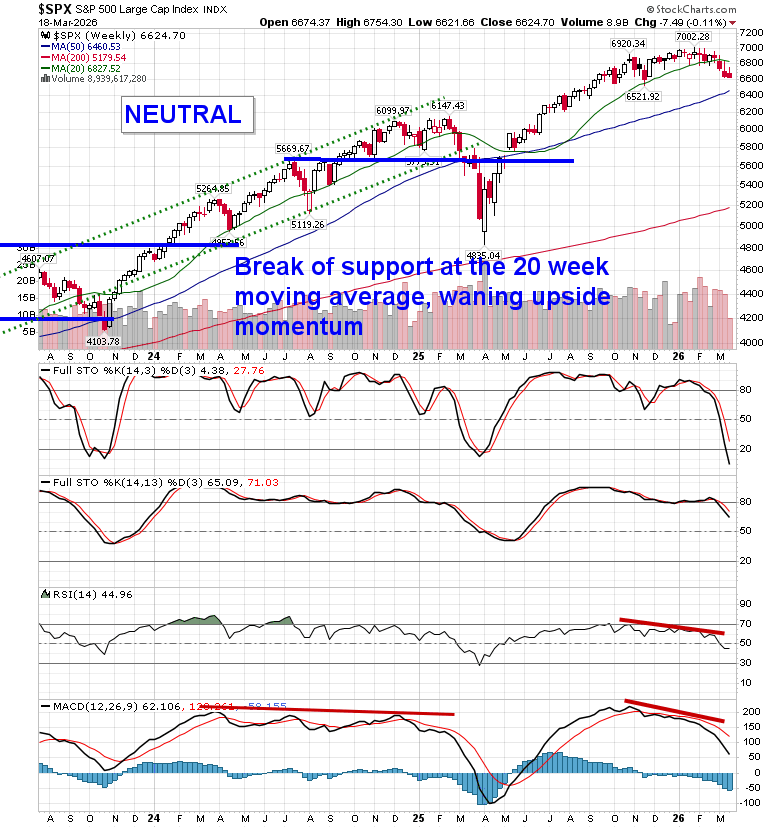
Stocks sold off on Wednesday as a hotter than expected read of inflationary pressures in the economy, a further rise in the price of Oil, and comments from Fed Chair Jerome Powell pushed traders to the sidelines. The S&P 500 Index closed down by 1.36%, reaching back to the year-to-date low that was recorded on Friday. The upside gap charted on Monday around 6650 has been filled and it has failed to act as support, signalling that the market has not yet exited this phase where levels of resistance are more meaningful than levels of support. The index continues to trade below the important 6900 pivot point that we have highlighted in our reporting and an ultra-short-term declining trend remains intact. The 100 and 150-day moving averages for the large-cap benchmark at 6840 and 6755, respectively, have been broken and the 200-day moving average (6615), which is mere points away, is critical to hold. As has been highlighted in our reporting, it would be difficult for the benchmark to slip below a range between 6500 and 6600 given the positive seasonality that is upon us, but, if this zone does break, we will have a longer-term topping pattern on the chart that stretches back many months to contend with. The speculative side of us (which we are not acting on, rather just entertaining) suggests that we hold the zone of support into the period of seasonal positivity for equity markets during the end of March and through the month of April, but ongoing strains ahead threatens the longer-term technical profile once the offseason for stocks gets underway in late April/early May. In the Seasonal Advantage Portfolio that we manage for clients at CastleMoore, we have been balancing the near-term risk-reward in the market, barbelling low volatility plays with pro-cyclical/commodity oriented bets, an approach that continues align with the trends in the market, but we are looking for our spot to ramp up risk exposure again, when the risk-reward makes sense. Subscribers can view the themes in our chart books to either Accumulate or Avoid that are working and intact.
Today, in our Market Outlook to subscribers, we discuss the following:
- Market Breakdown: Implied Support Fails
- Inflation Shock Drives Risk-Off Move
- Oil Surge Adds to Macro Pressure
- Fed + Rates = Headwind for Stocks
- Portfolio Strategy: Inflation Hedges Remain Desirable
- Gold Momentum Lost
- Energy Market Outlook: Tightening Ahead
- Consumer Under Pressure
- Sentiment: Not Capitulative Yet (But Getting Closer)
- Strategy Going Forward
Subscribers can look for this report in their inbox or by clicking on the following link and logging in: Market Outlook for March 19
Not signed up yet? Subscribe now to receive full access to all of the research and analysis that we publish
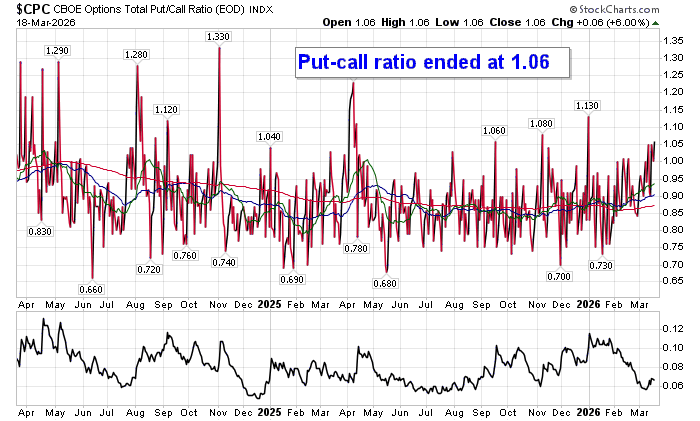
Sentiment on Wednesday, as gauged by the put-call ratio, ended bearish at 1.06.
Seasonal charts of companies reporting earnings today:


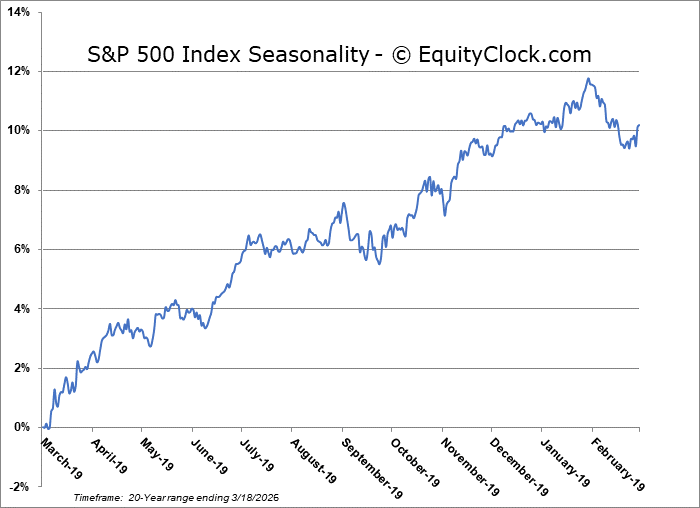
S&P 500 Index
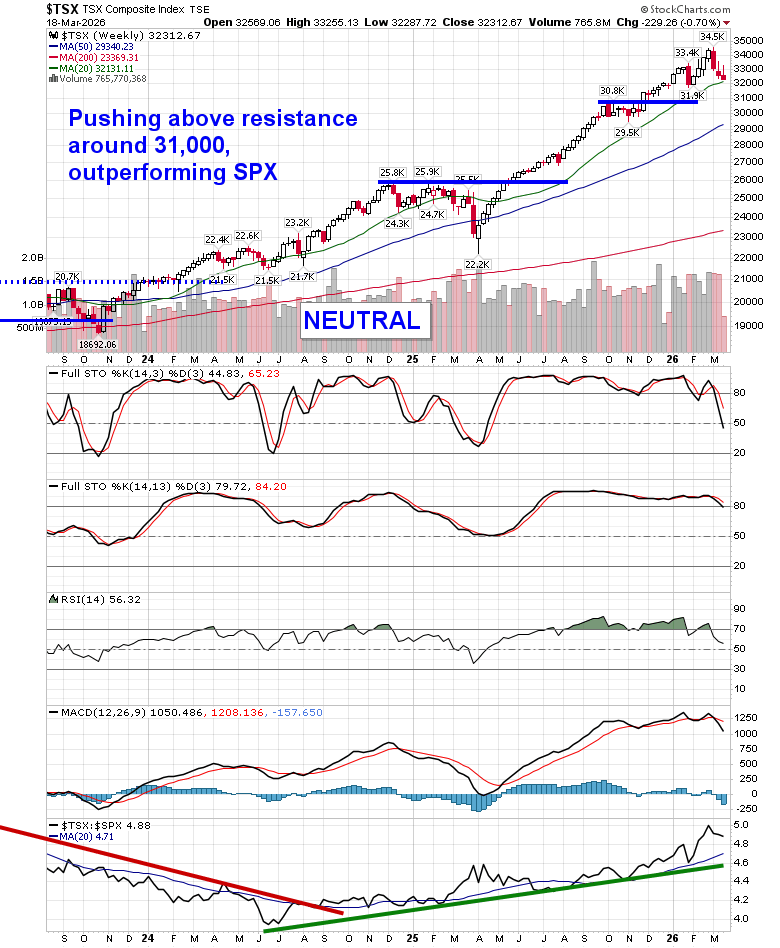
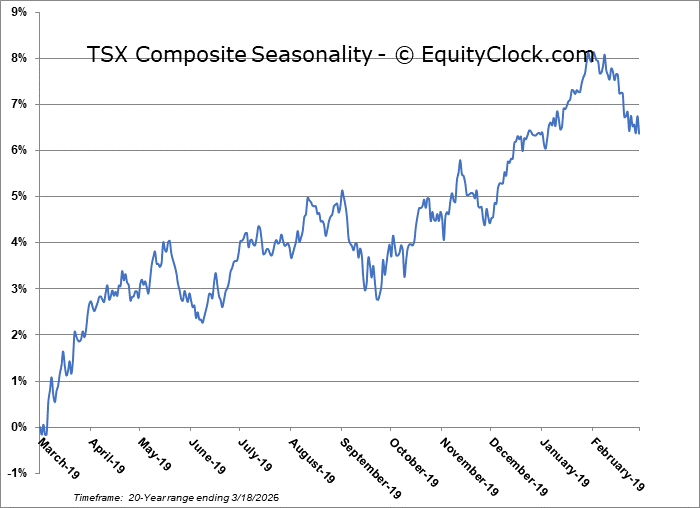
TSE Composite
| Sponsored By... |

|


