Stock Market Outlook for April 28, 2026

The technicals of Consumer segments of the market showing degradation as the high price of energy commodities weighs.
*** Stocks highlighted are for information purposes only and should not be considered as advice to purchase or to sell mentioned securities. As always, the use of technical and fundamental analysis is encouraged in order to fine tune entry and exit points to average seasonal trends.
Stocks Entering Period of Seasonal Strength Today:
Subscribers Click on the relevant link to view the full profile. Not a subscriber? Signup here.
Stock Highlight: |
|

Gabelli Utility Trust (NYSE:GUT) Seasonal Chart |
|

Westport Innovations, Inc. (TSE:WPRT.TO) Seasonal Chart

eXp World Holdings Inc. (NASD:EXPI) Seasonal Chart

Roku, Inc. (NASD:ROKU) Seasonal Chart
Disclaimer: Comments and opinions offered in this report are for information only. They should not be considered as advice to purchase or to sell mentioned securities. Data offered is believed to be accurate, but is not guaranteed.
The Markets
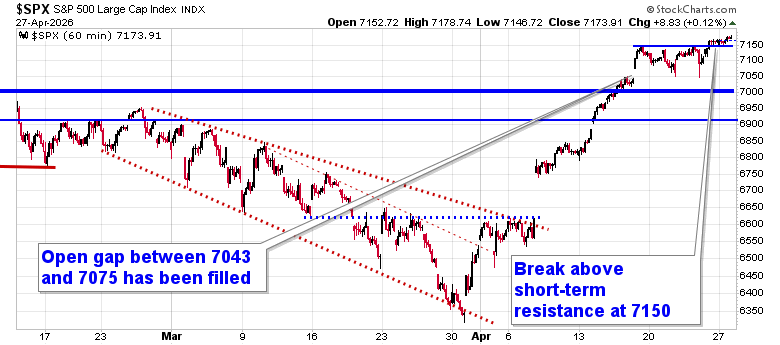
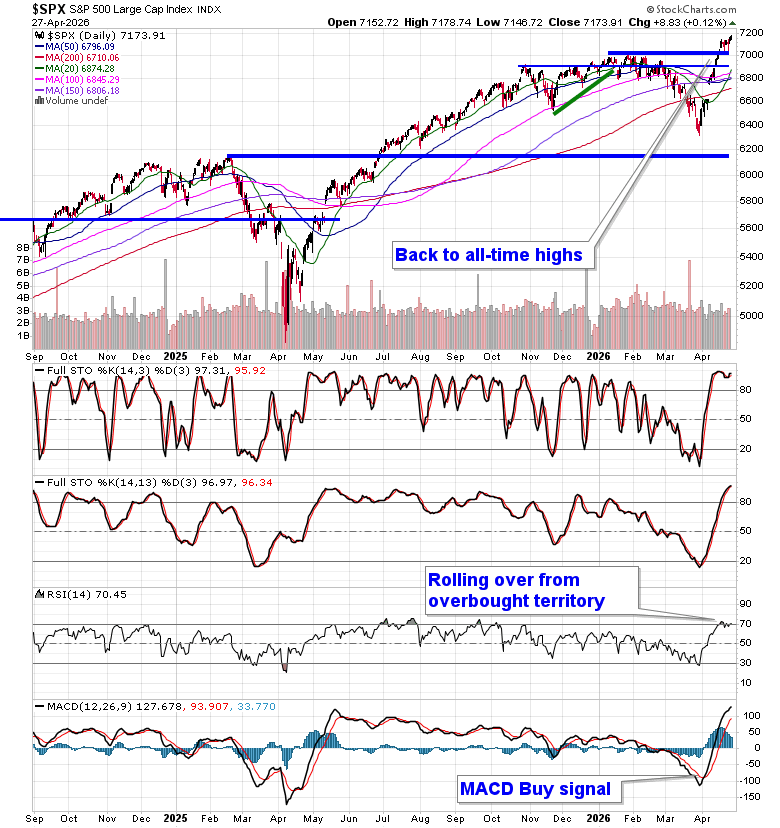
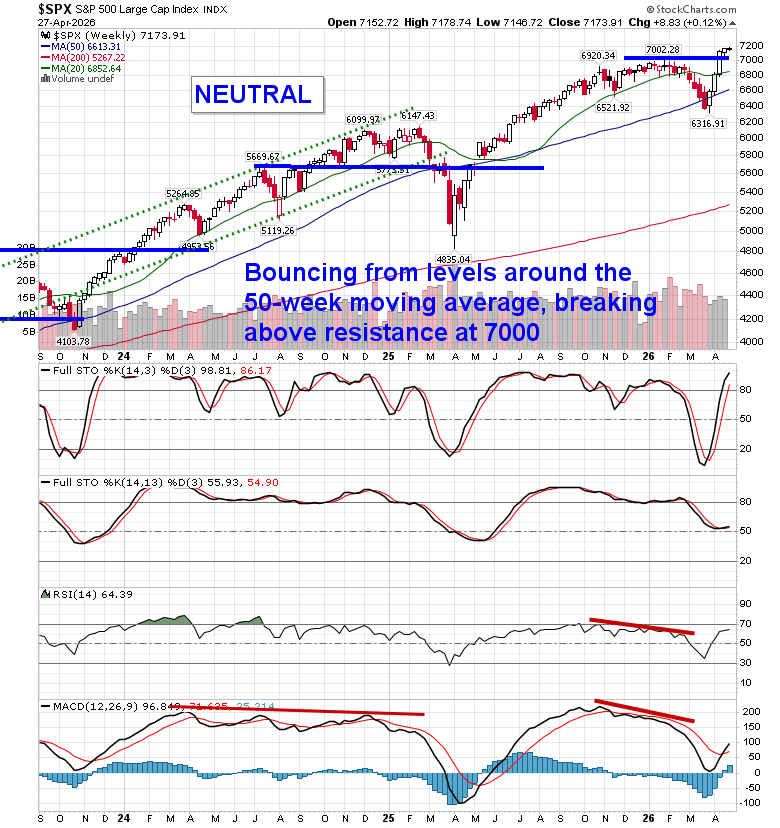
Stocks were little changed on Monday, despite the ongoing rise in the price of energy commodities, as traders held the tape steady ahead of the release of major tech earnings in the days ahead. The S&P 500 Index ended higher by just over a tenth of one percent, holding above the prior short-term cap around 7150 that was highlighted as a point of resistance last week. A number of gaps remain unfilled below, including the big one between 6620 and 6740, but, ultimately, the character of the market has changed where levels of resistance hold less weight than levels of support (and this was proven again by the violation of resistance on Friday). Downside risks in the near-term can be pegged towards levels around 6900, but, we are still playing with a positive side bias (albeit with some hedges that have been added in recent days – see our April 22 Market Outlook). Momentum indicators have been rolling over from overbought territory, highlighting upside exhaustion and lending themselves to the prospect of a digestive phase on the horizon, particularly once we get beyond the height to earnings season this week. In the Seasonal Advantage Portfolio (which is strongly higher YTD, continuing to set new high watermarks) that we manage for clients at CastleMoore, we continue to be fully exposed to risk (stocks) after flipping from our low volatility stance around the end of March and our performance is benefiting. The conflict in Iran remains a wildcard and we are running down our cues that would warrant a more defensive posture in risk assets. Subscribers can view the themes in our chart books to either Accumulate or Avoid that we continue to gear portfolios towards.
Want to know which areas of the market to buy or sell? Our Weekly Chart Books have just been updated, providing a clear Accumulate, Avoid, or Neutral rating for currencies, cryptocurrencies, commodities, broad markets, and subsectors/industries of the market. Subscribers can login and click on the relevant links to access.
- Currencies
- Cryptocurrencies
- Commodities
- Major Benchmarks
- Sub-sectors / Industries
- ETFs: Bonds | Commodities | Equity Markets | Industries | Sectors
Subscribe now.
Today, in our Market Outlook to subscribers, we discuss the following:
- Market Trend & Positioning
- Sentiment & Risk Environment
- Seasonality Warning
- Macro Headwinds Emerging
- Sector & Strategy Shifts – Ratings changes and our list of all segments of the market to either Accumulate or Avoid
- Key Strategic Message
Subscribers can look for this report in their inbox or by clicking on the following link and logging in: Market Outlook for April 28
Not signed up yet? Subscribe now to receive full access to all of the research and analysis that we publish
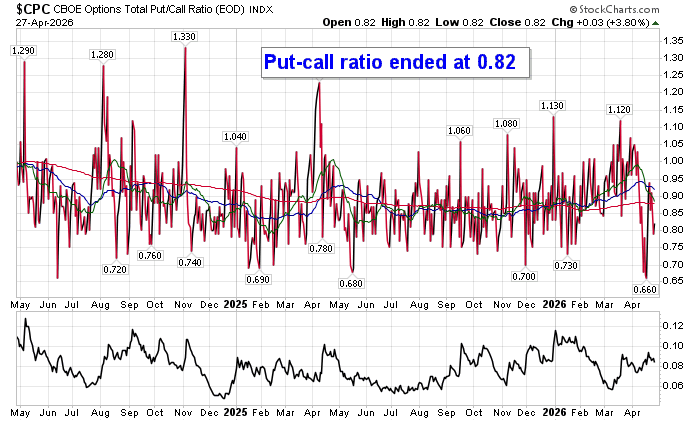
Sentiment on Monday, as gauged by the put-call ratio, ended bullish at 0.82.
Seasonal charts of companies reporting earnings today:


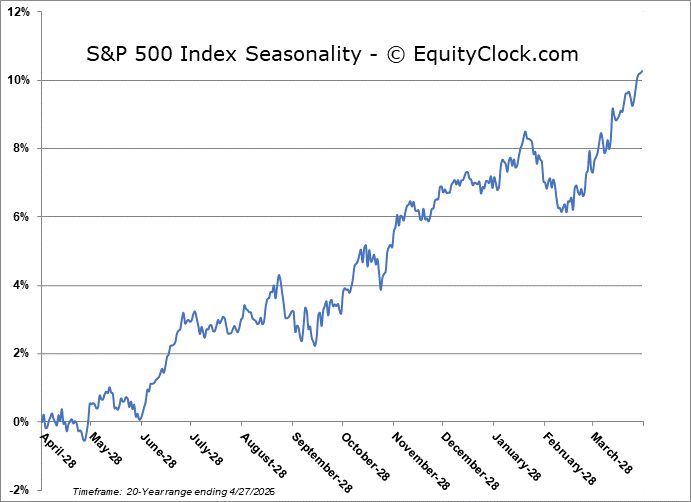
S&P 500 Index
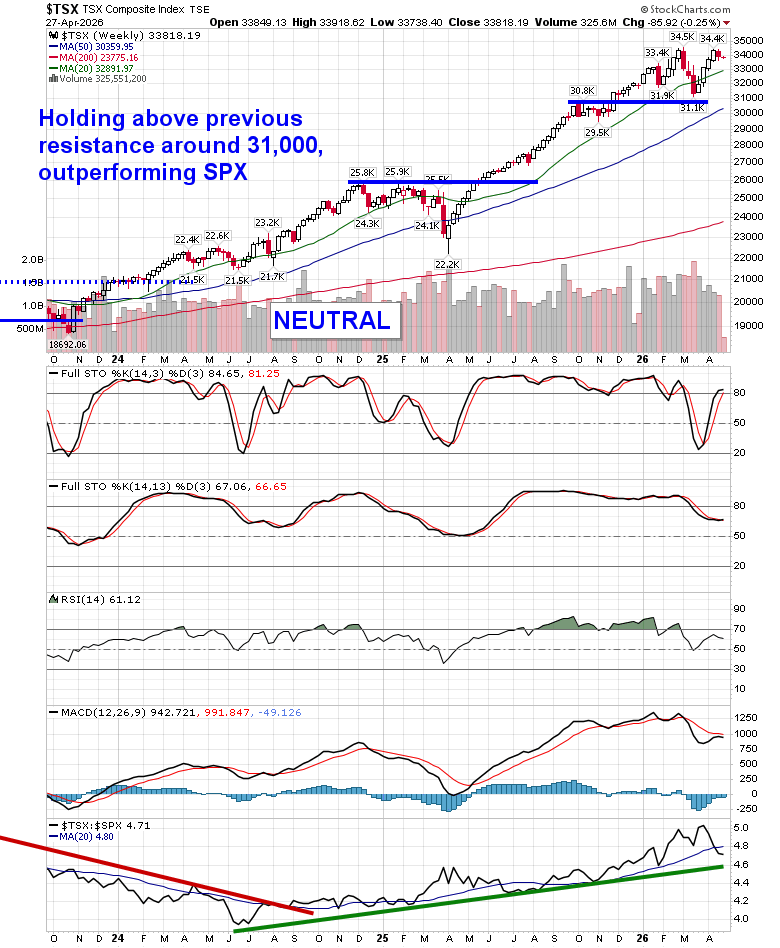
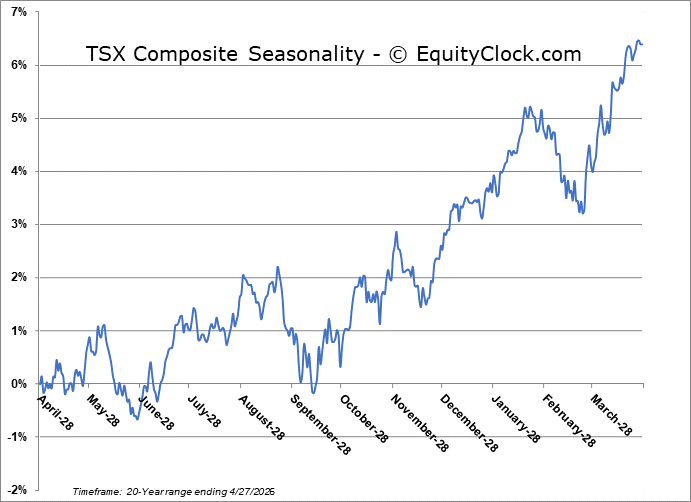
TSE Composite
| Sponsored By... |

|


