Stock Market Outlook for April 22, 2026

Identifying tactical hedging opportunities to protect recent portfolio gains.
*** Stocks highlighted are for information purposes only and should not be considered as advice to purchase or to sell mentioned securities. As always, the use of technical and fundamental analysis is encouraged in order to fine tune entry and exit points to average seasonal trends.
Stocks Entering Period of Seasonal Strength Today:
Subscribers Click on the relevant link to view the full profile. Not a subscriber? Signup here.
Stock Highlight: |
|

Ouster, Inc. (NASD:OUST) Seasonal Chart |
|
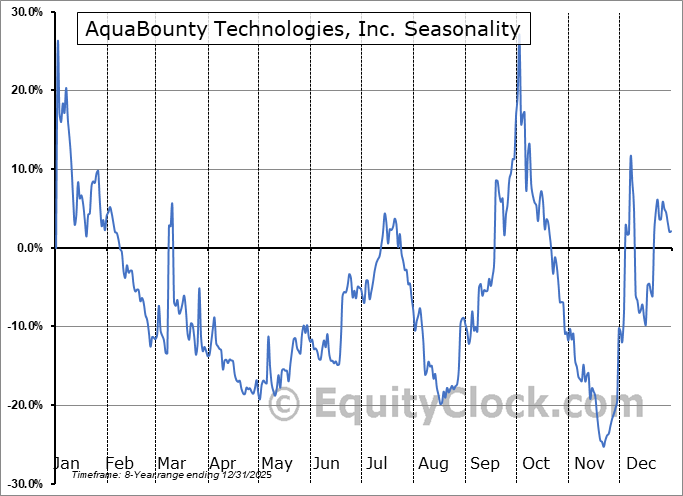
AquaBounty Technologies, Inc. (NASD:AQB) Seasonal Chart
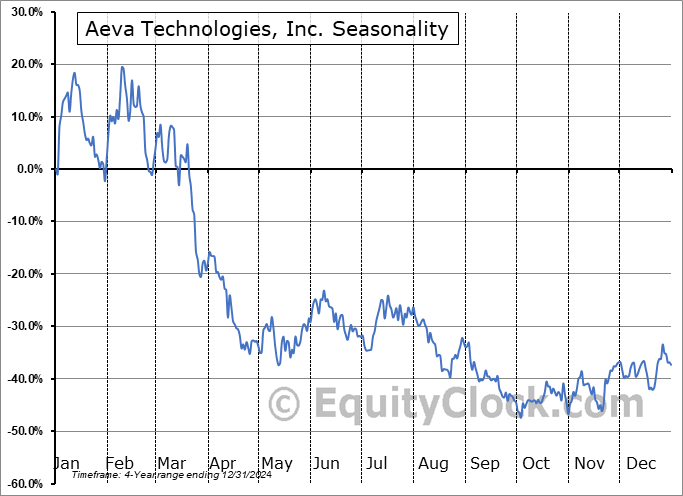
Aeva Technologies, Inc. (NASD:AEVA) Seasonal Chart
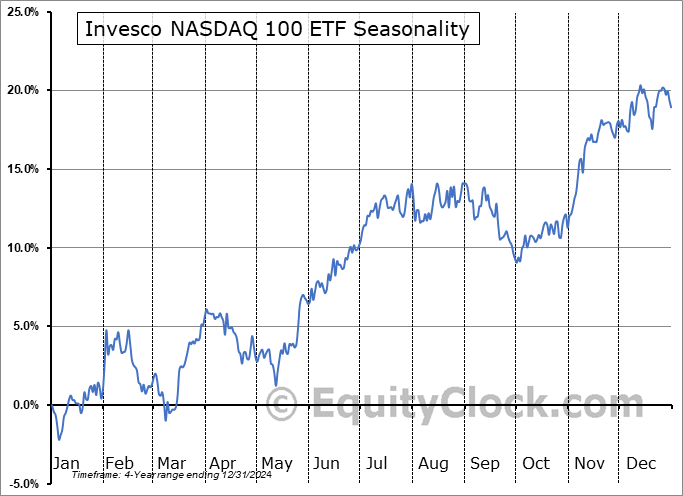
Invesco NASDAQ 100 ETF (NASD:QQQM) Seasonal Chart

Triumph Financial, Inc. (NYSE:TFIN) Seasonal Chart
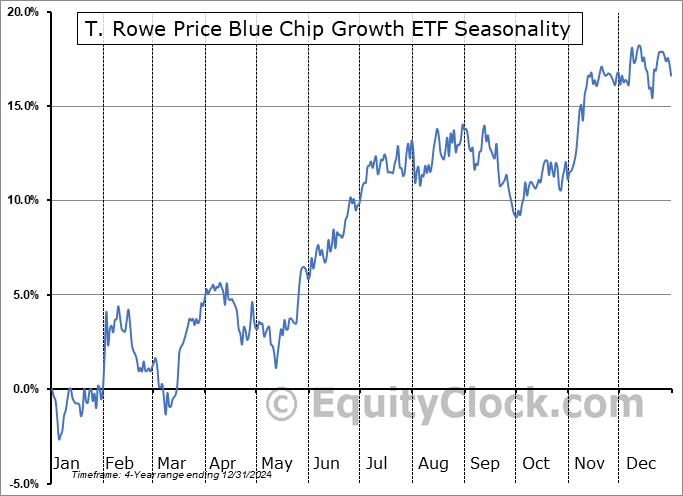
T. Rowe Price Blue Chip Growth ETF (AMEX:TCHP) Seasonal Chart
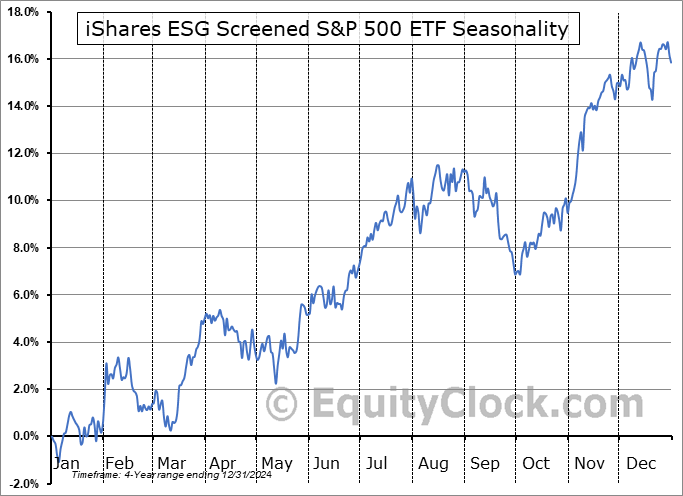
iShares ESG Screened S&P 500 ETF (AMEX:XVV) Seasonal Chart
Disclaimer: Comments and opinions offered in this report are for information only. They should not be considered as advice to purchase or to sell mentioned securities. Data offered is believed to be accurate, but is not guaranteed.
The Markets
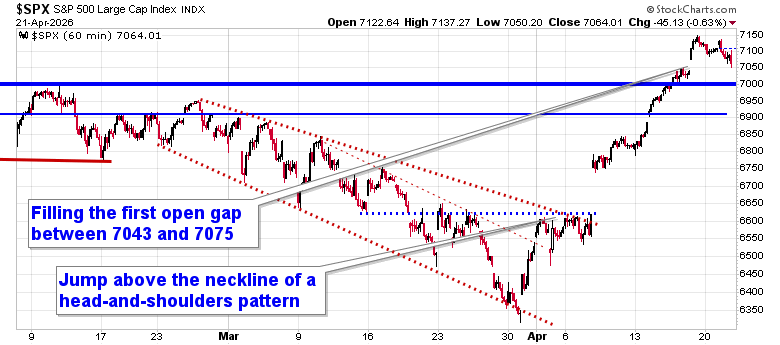
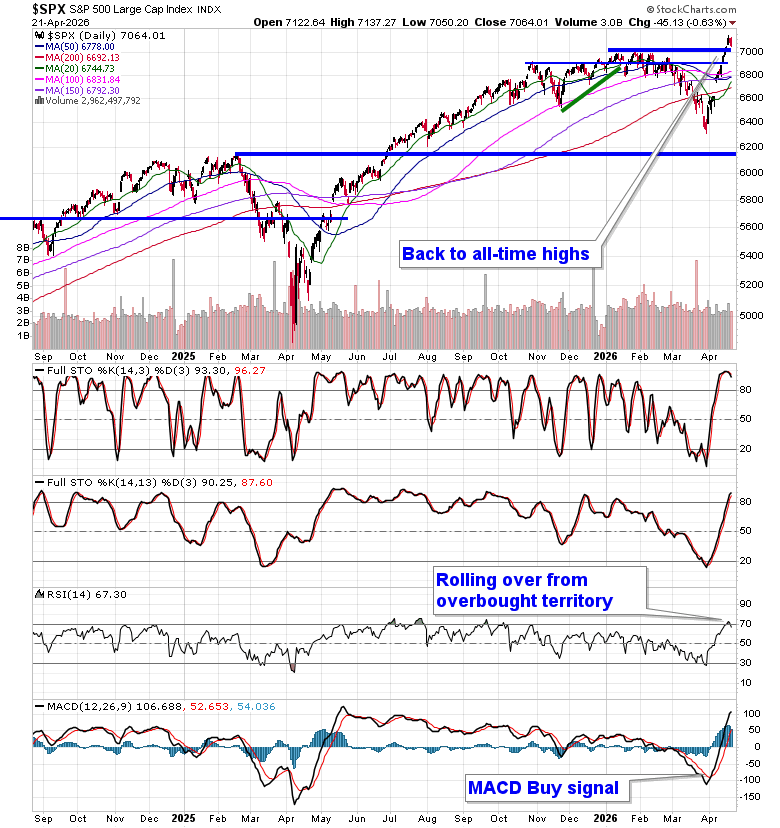
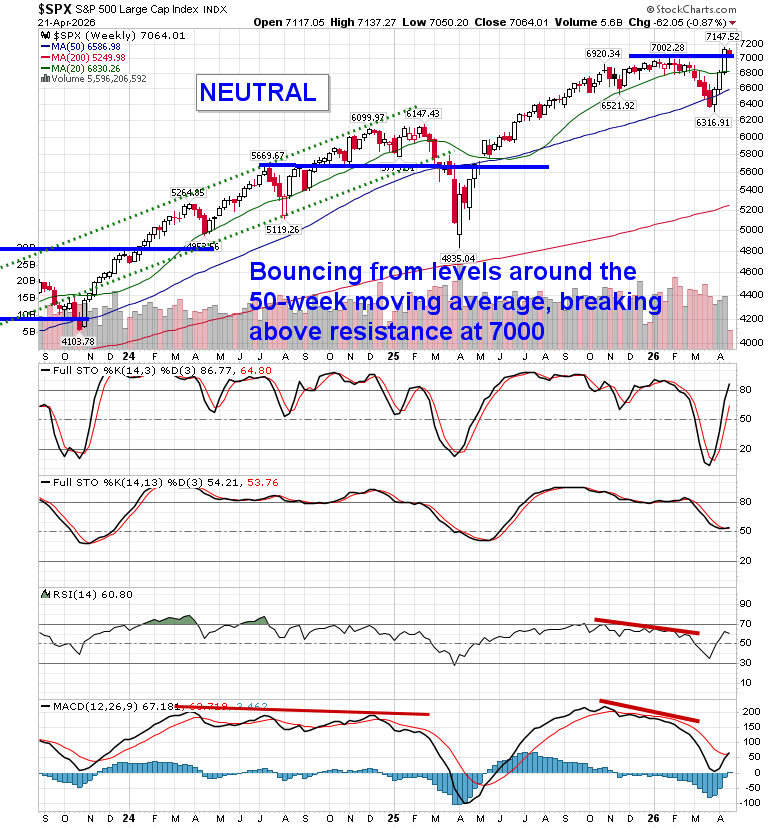
Uncertainty heading into Wednesday’s ceasefire deadline between the US and Iran sent stocks lower on Tuesday. The S&P 500 Index closed down by just over six-tenths of one percent, remaining elevated above the previous peak that was charted in January around 7,000. A number of gaps remain unfilled below, including the big one between 6620 and 6740, but, ultimately, the character of the market has changed where levels of resistance hold less weight than levels of support. A small upside gap opened on Friday between 7043 and 7075 is now being tested and scrutinized to see if the buyers will step in; below this zone, last Tuesday’s gap between 6885 and 6905 is the likely target. Momentum indicators are rolling over from overbought territory, highlighting the upside exhaustion that we had been noting in recent days. In the Seasonal Advantage Portfolio (which is strongly higher YTD, continuing to set new high watermarks) that we manage for clients at CastleMoore, we continue to be fully exposed to risk (stocks) after flipping from our low volatility stance around the end of March and our performance is benefitting. The conflict in Iran remains a wildcard and we are running down our cues that would warrant a more defensive posture in risk assets. While we do not have the signals to sell equity exposure, some portfolio hedges here are probably prudent and we lay out some ideas in today’s report. Subscribers can view the themes in our chart books to either Accumulate or Avoid that we continue to gear portfolios towards.
Today, in our Market Outlook to subscribers, we discuss the following:
- Market Pullback Within a Bullish Trend
- Geopolitical Risk Is Front and Center
- Shift in Strategy: Add Hedges, Not Exposure
- Key Macro Risks to Watch
- Tactical Short Opportunity
- Copper Over Gold
- Other Hedging Ideas in the Market
- Consumer: Still Spending, But Risks to the Outlook
- Auto Sector Weakness Emerging
Subscribers can look for this report in their inbox or by clicking on the following link and logging in: Market Outlook for April 22
Not signed up yet? Subscribe now to receive full access to all of the research and analysis that we publish
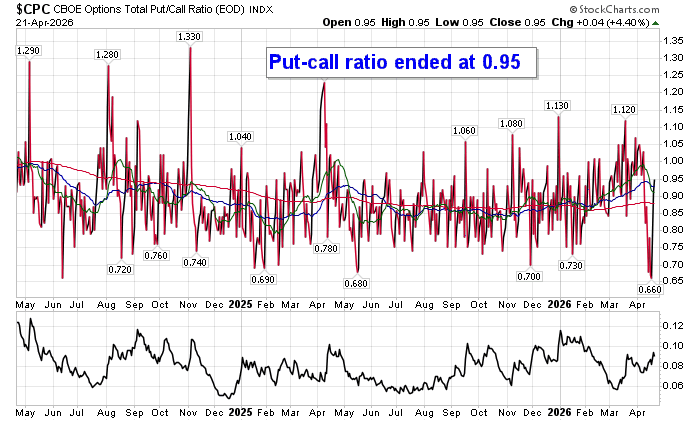
Sentiment on Tuesday, as gauged by the put-call ratio, ended close to Neutral at 0.95.
Seasonal charts of companies reporting earnings today:


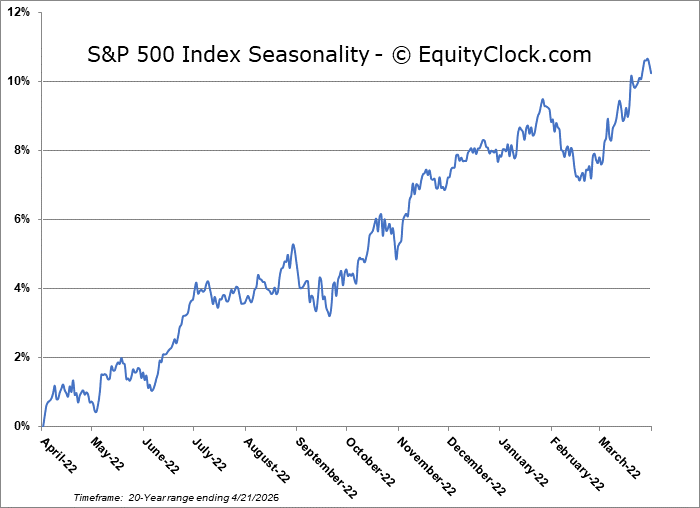
S&P 500 Index
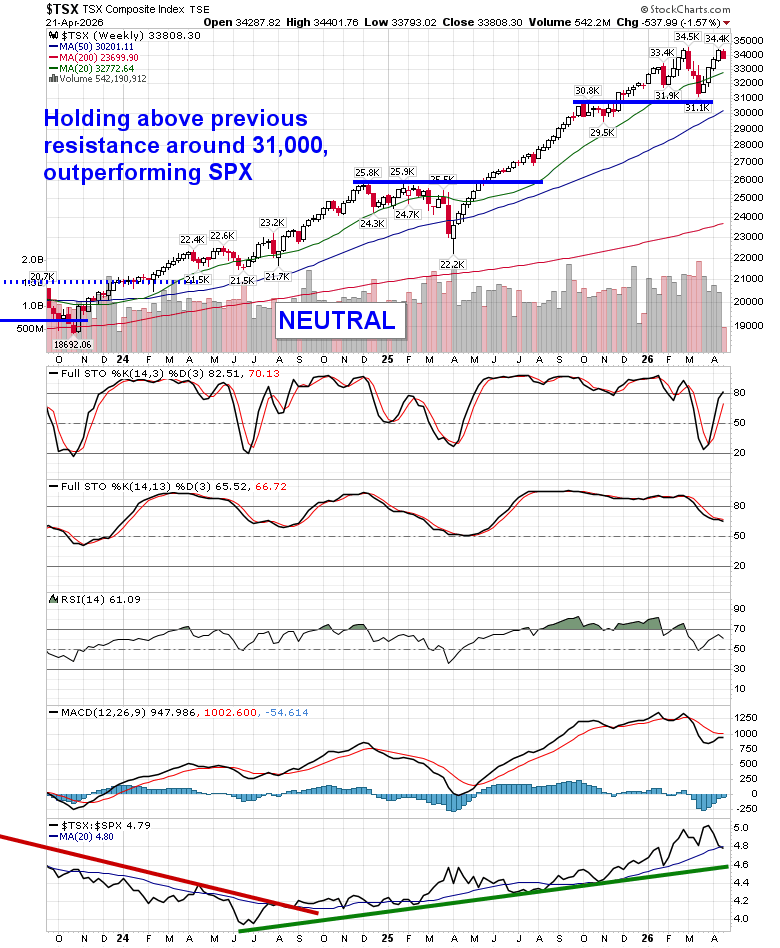
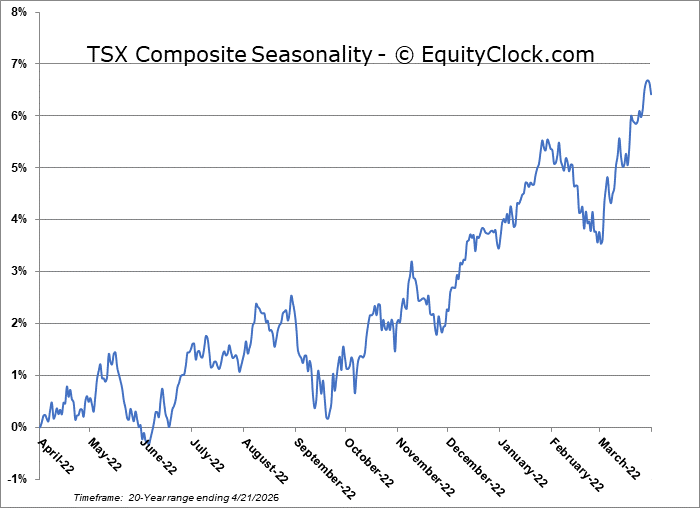
TSE Composite
| Sponsored By... |

|


