Stock Market Outlook for April 20, 2026

Complacency is high in the market as those that sold around the March lows get left behind.
*** Stocks highlighted are for information purposes only and should not be considered as advice to purchase or to sell mentioned securities. As always, the use of technical and fundamental analysis is encouraged in order to fine tune entry and exit points to average seasonal trends.
Stocks Entering Period of Seasonal Strength Today:
Subscribers Click on the relevant link to view the full profile. Not a subscriber? Signup here.
Stock Highlight: |
|

Northwest Pipe Co. (NASD:NWPX) Seasonal Chart |
|

Vanguard S&P Small-Cap 600 Growth ETF (NYSE:VIOG) Seasonal Chart

Legend Biotech Corp (NASD:LEGN) Seasonal Chart

Biogen Inc. (NASD:BIIB) Seasonal Chart

Neogen Corp. (NASD:NEOG) Seasonal Chart

ICU Medical, Inc. (NASD:ICUI) Seasonal Chart

Logitech Intl S.A. (NASD:LOGI) Seasonal Chart

IDEAYA Biosciences, Inc. (NASD:IDYA) Seasonal Chart

NVE Corp. (NASD:NVEC) Seasonal Chart
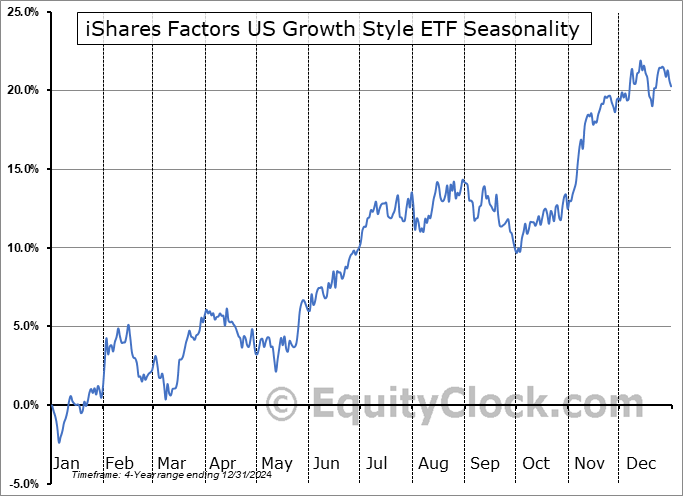
iShares Factors US Growth Style ETF (AMEX:GARP) Seasonal Chart

iShares Global Tech ETF (NYSE:IXN) Seasonal Chart

Invesco DWA Technology Momentum ETF (NASD:PTF) Seasonal Chart
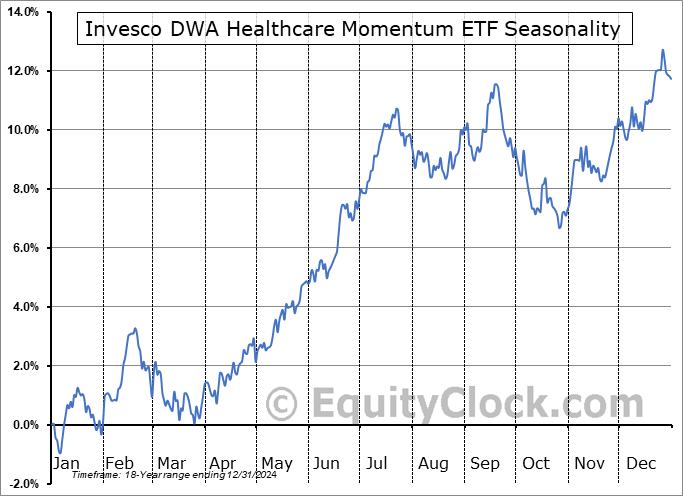
Invesco DWA Healthcare Momentum ETF (NASD:PTH) Seasonal Chart

Technology Select Sector SPDR Fund (NYSE:XLK) Seasonal Chart

Baozun Inc. (NASD:BZUN) Seasonal Chart

Stoke Therapeutics Inc. (NASD:STOK) Seasonal Chart

Valvoline Inc. (NYSE:VVV) Seasonal Chart
Disclaimer: Comments and opinions offered in this report are for information only. They should not be considered as advice to purchase or to sell mentioned securities. Data offered is believed to be accurate, but is not guaranteed.
The Markets
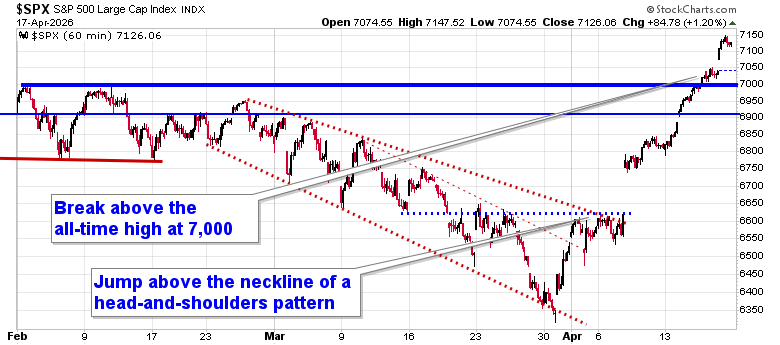
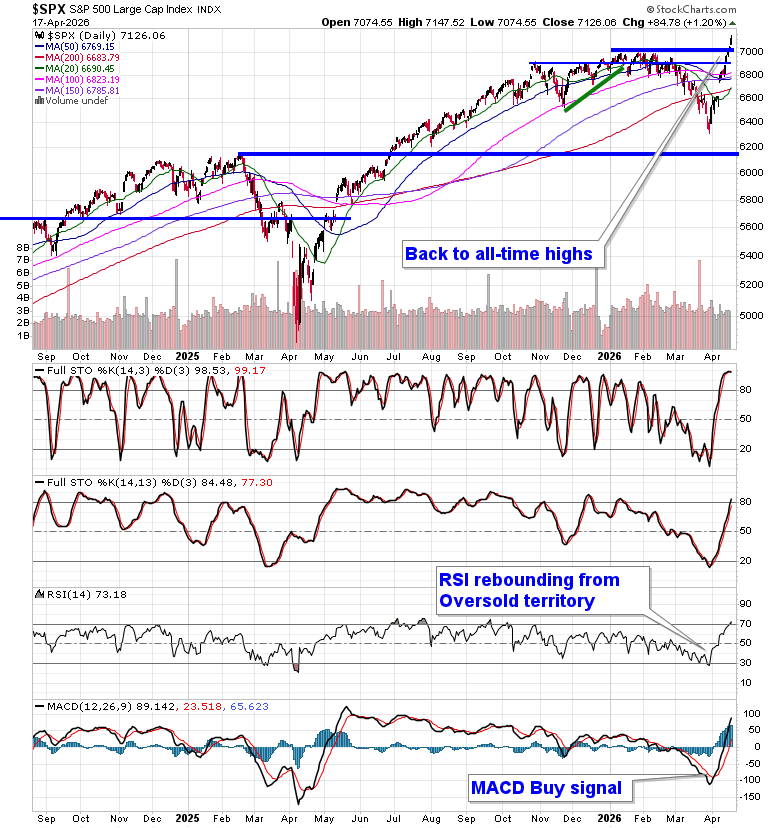
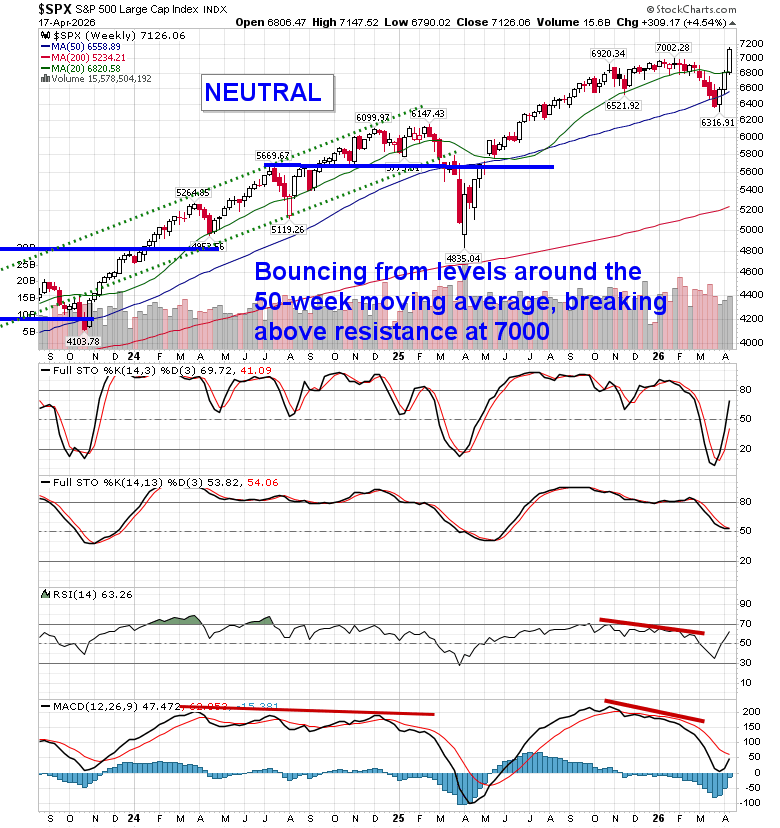
News of the reopening of the Strait of Hormuz added fuel to what has already been a strong recovery in the market from the March lows. The S&P 500 Index closed up 1.20%, continuing to elevate above the previous peak that was charted in January around 7,000. A number of gaps remain unfilled below, including the big one between 6620 and 6740, but, ultimately, the character of the market has changed where levels of resistance hold less weight than levels of support. A small upside gap opened on Friday between 7043 and 7075 is now the first zone to watch for reaction as potential support on a retracement/digestion of recent gains, along with Tuesday’s gap between 6885 and 6905. Momentum indicators are overbought and are still showing early signs of upside exhaustion, but there is no actionable catalyst to shift/sell portfolio exposure, yet, based on the potential maturing of the recovery off of the end of March low. In the Seasonal Advantage Portfolio (which is strongly higher YTD, continuing to set new high watermarks) that we manage for clients at CastleMoore, we continue to be fully exposed to risk (stocks) after flipping from our low volatility stance around the end of March and our performance is benefitting. The conflict in Iran remains a wildcard and we are running down our cues that would warrant a more defensive posture in risk assets. Subscribers can view the updated list of themes in our chart books to either Accumulate or Avoid that we continue to gear portfolios towards.
Today, in our Market Outlook to subscribers, we discuss the following:
- Market Trend & Technical Setup
- Overbought Conditions
- Weak Market Breadth & Participation
- Energy Market Opportunity
- Portfolio Positioning
- Sentiment & Risk Signals
- Big Picture
Subscribers can look for this report in their inbox or by clicking on the following link and logging in: Market Outlook for April 20
Not signed up yet? Subscribe now to receive full access to all of the research and analysis that we publish
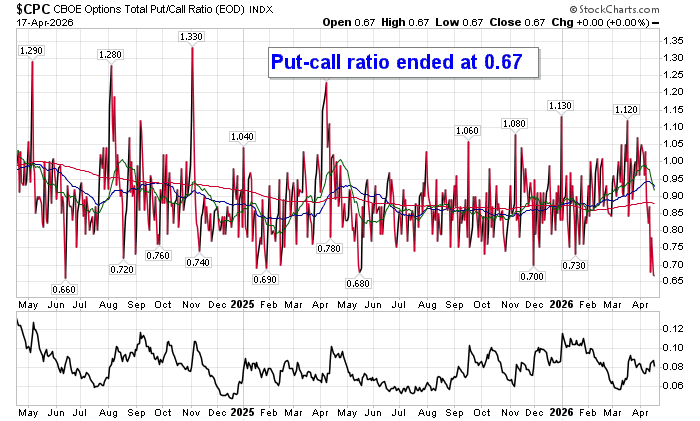
Sentiment on Friday, as gauged by the put-call ratio, ended overly bullish at 0.67.
Seasonal charts of companies reporting earnings today:


S&P 500 Index
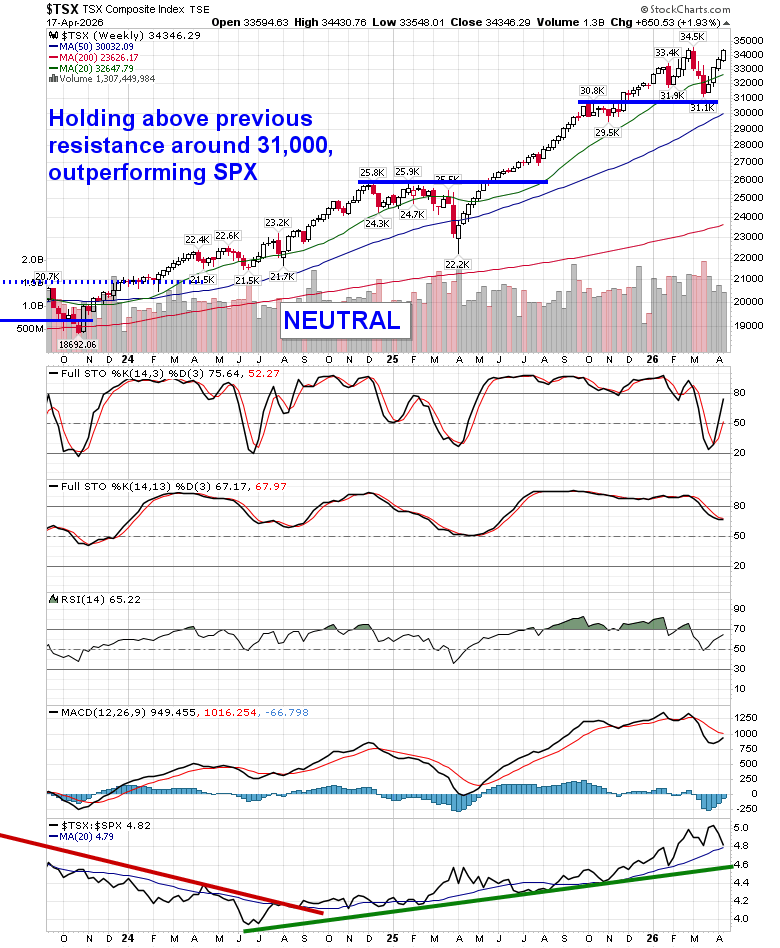
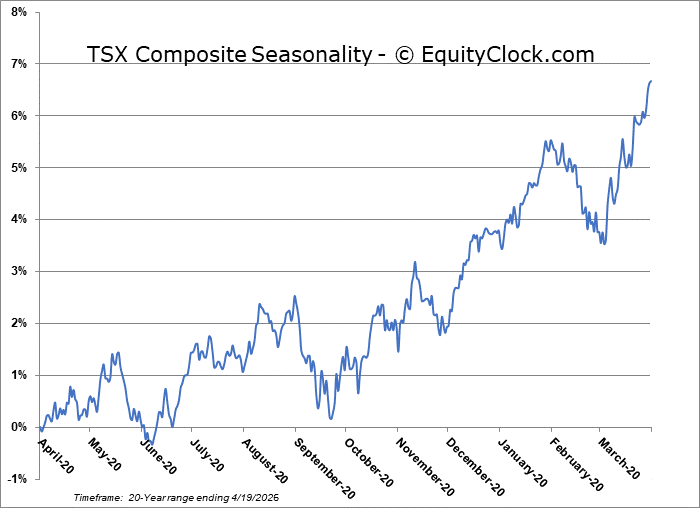
TSE Composite
| Sponsored By... |

|


