Stock Market Outlook for April 21, 2026

Still Bullish, But Losing Easy Upside
*** Stocks highlighted are for information purposes only and should not be considered as advice to purchase or to sell mentioned securities. As always, the use of technical and fundamental analysis is encouraged in order to fine tune entry and exit points to average seasonal trends.
Stocks Entering Period of Seasonal Strength Today:
Subscribers Click on the relevant link to view the full profile. Not a subscriber? Signup here.
Stock Highlight: |
|
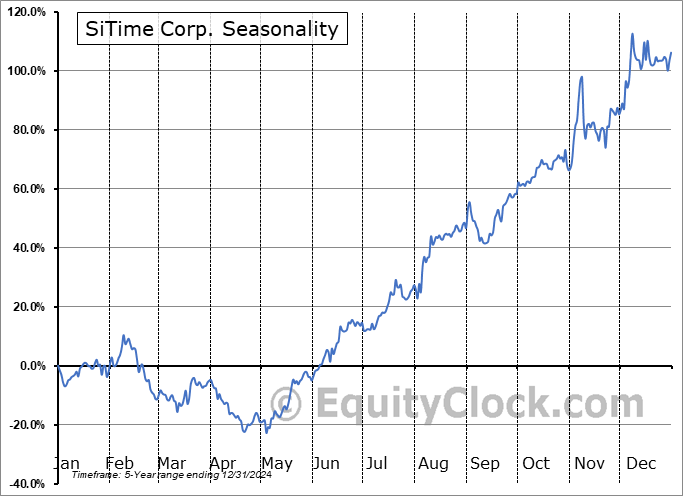
SiTime Corp. (NASD:SITM) Seasonal Chart |
|

Kura Oncology, Inc (NASD:KURA) Seasonal Chart

Fidelity MSCI Information Technology Index ETF (AMEX:FTEC) Seasonal Chart

iShares Evolved U.S. Technology ETF (AMEX:IETC) Seasonal Chart

SPDR S&P Kensho Smart Mobility ETF (AMEX:HAIL) Seasonal Chart

ClearBridge Large Cap Growth ESG ETF (NASD:LRGE) Seasonal Chart

PagSeguro Digital Ltd. (NYSE:PAGS) Seasonal Chart

Green Dot Corp. (NYSE:GDOT) Seasonal Chart
Disclaimer: Comments and opinions offered in this report are for information only. They should not be considered as advice to purchase or to sell mentioned securities. Data offered is believed to be accurate, but is not guaranteed.
The Markets
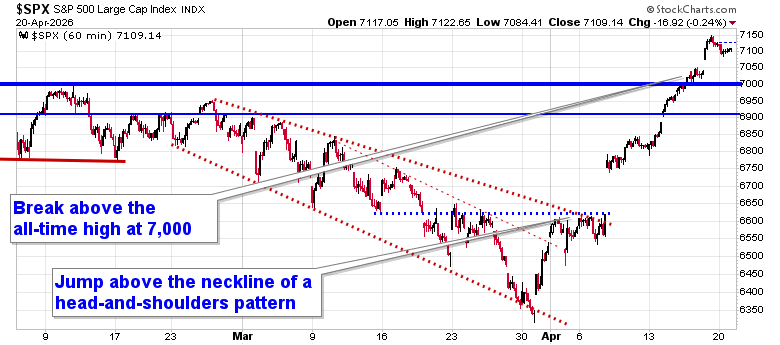
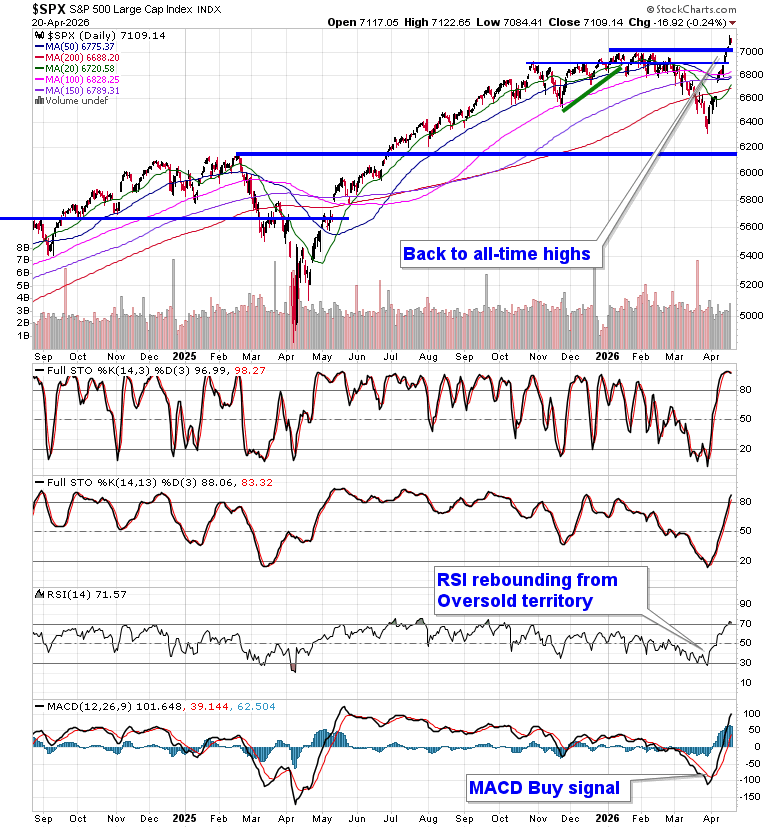
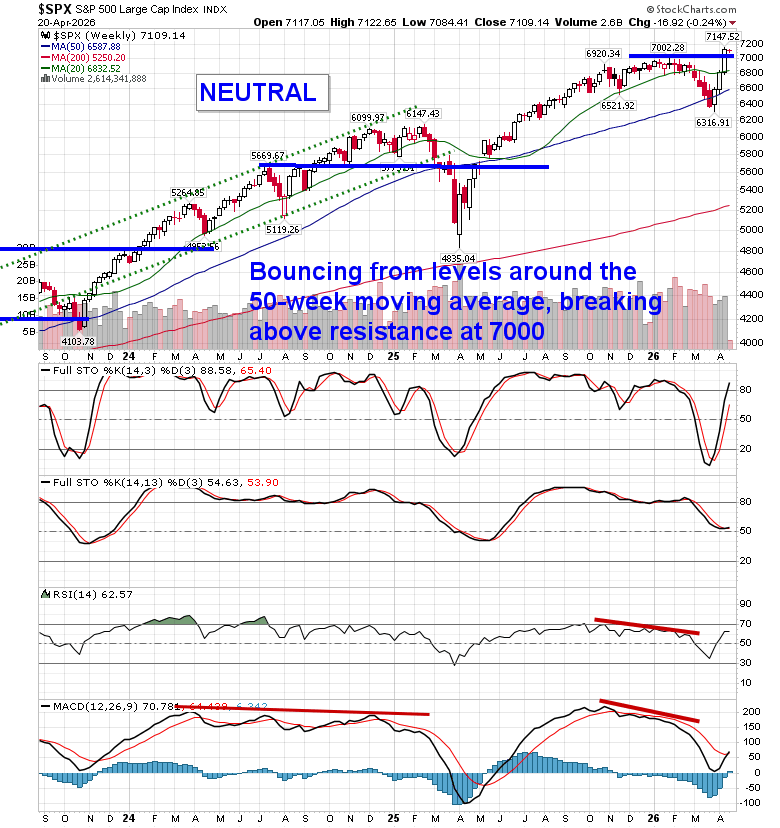
An escalation of tensions between the US and Iran sent the price of Oil higher Monday and reversed some of Friday’s equity market gains. The S&P 500 Index shed just less than a quarter of one percent, remaining elevated above the previous peak that was charted in January around 7,000. A number of gaps remain unfilled below, including the big one between 6620 and 6740, but, ultimately, the character of the market has changed where levels of resistance hold less weight than levels of support. A small upside gap opened on Friday between 7043 and 7075 is now the first zone to watch for reaction as potential support on a retracement/digestion of recent gains, along with last Tuesday’s gap between 6885 and 6905. Momentum indicators are overbought and are still showing early signs of upside exhaustion, but there is no actionable catalyst to shift/sell portfolio exposure, yet, based on the potential maturing of the recovery off of the end of March low. In the Seasonal Advantage Portfolio (which is strongly higher YTD, continuing to set new high watermarks) that we manage for clients at CastleMoore, we continue to be fully exposed to risk (stocks) after flipping from our low volatility stance around the end of March and our performance is benefitting. The conflict in Iran remains a wildcard and we are running down our cues that would warrant a more defensive posture in risk assets. Subscribers can view the updated list of themes in our chart books to either Accumulate or Avoid that we continue to gear portfolios towards.
Want to know which areas of the market to buy or sell? Our Weekly Chart Books have just been updated, providing a clear Accumulate, Avoid, or Neutral rating for currencies, cryptocurrencies, commodities, broad markets, and subsectors/industries of the market. Subscribers can login and click on the relevant links to access.
- Currencies
- Cryptocurrencies
- Commodities
- Major Benchmarks
- Sub-sectors / Industries
- ETFs: Bonds | Commodities | Equity Markets | Industries | Sectors
Subscribe now.
Today, in our Market Outlook to subscribers, we discuss the following:
- Market Trend: Still Bullish, But Losing Easy Upside
- Complacency Is Now the Biggest Risk
- Positioning Strategy
- Macro Risk: Oil & Iran Conflict
- Rotation: Growth Re-emerging (But Fragile)
- New Accumulate Themes
- Seasonality Warning (Big Picture)
Subscribers can look for this report in their inbox or by clicking on the following link and logging in: Market Outlook for April 21
Not signed up yet? Subscribe now to receive full access to all of the research and analysis that we publish
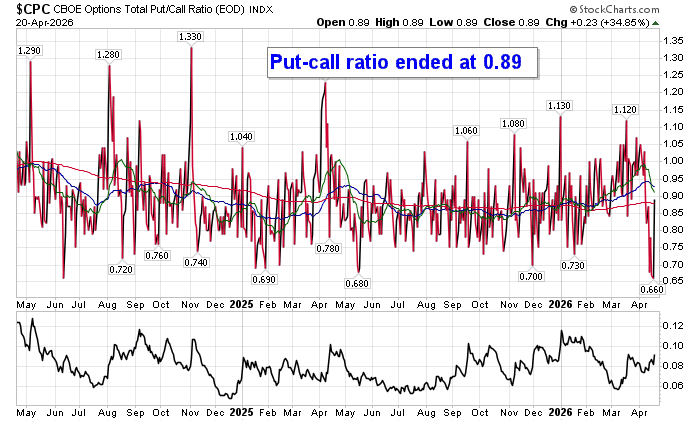
Sentiment on Monday, as gauged by the put-call ratio, ended bullish at 0.89.
Seasonal charts of companies reporting earnings today:


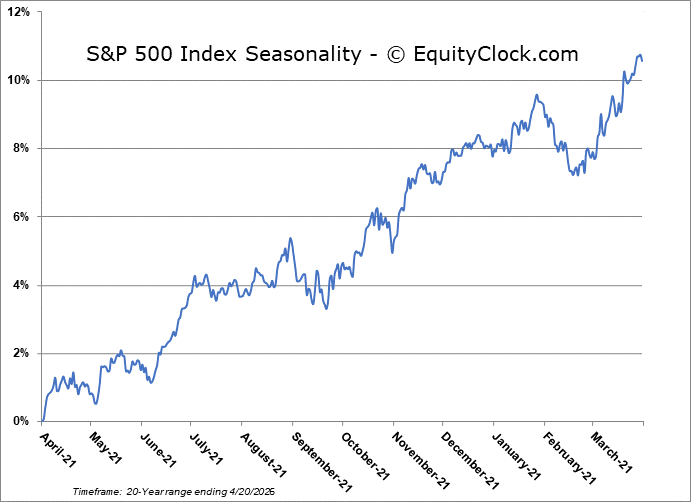
S&P 500 Index
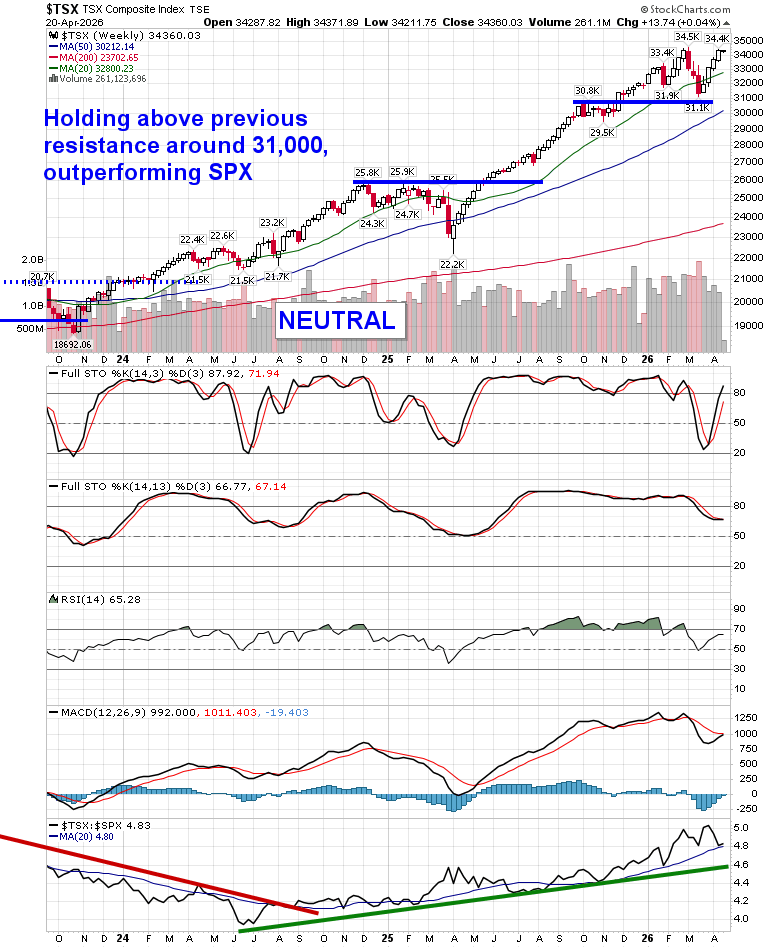
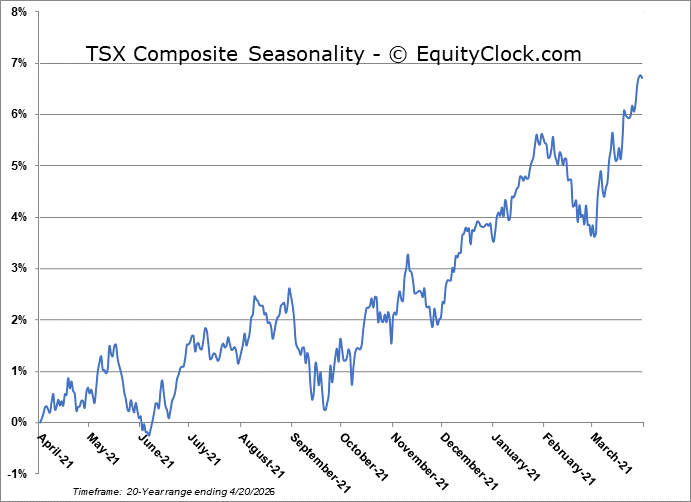
TSE Composite
| Sponsored By... |

|


