Stock Market Outlook for April 30, 2026

Looking to navigate through the May/June timeframe for stocks with cues from durable goods orders, housing, and energy supply/demand.
*** Stocks highlighted are for information purposes only and should not be considered as advice to purchase or to sell mentioned securities. As always, the use of technical and fundamental analysis is encouraged in order to fine tune entry and exit points to average seasonal trends.
Stocks Entering Period of Seasonal Strength Today:
Subscribers Click on the relevant link to view the full profile. Not a subscriber? Signup here.
Stock Highlight: |
|

Invesco S&P 500 Pure Growth ETF (NYSE:RPG) Seasonal Chart |
|

USANA Health Sciences, Inc. (NYSE:USNA) Seasonal Chart

Chewy Inc. (NYSE:CHWY) Seasonal Chart

Vanguard S&P 500 Growth ETF (NYSE:VOOG) Seasonal Chart

Pinterest Inc. (NYSE:PINS) Seasonal Chart

Zoom Video Communications, Inc. (NASD:ZM) Seasonal Chart
Disclaimer: Comments and opinions offered in this report are for information only. They should not be considered as advice to purchase or to sell mentioned securities. Data offered is believed to be accurate, but is not guaranteed.
The Markets
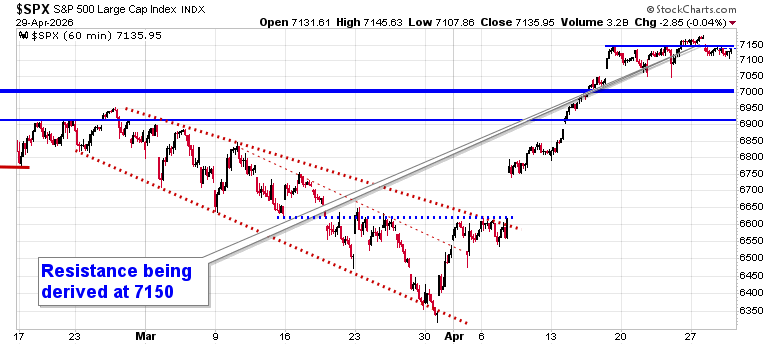
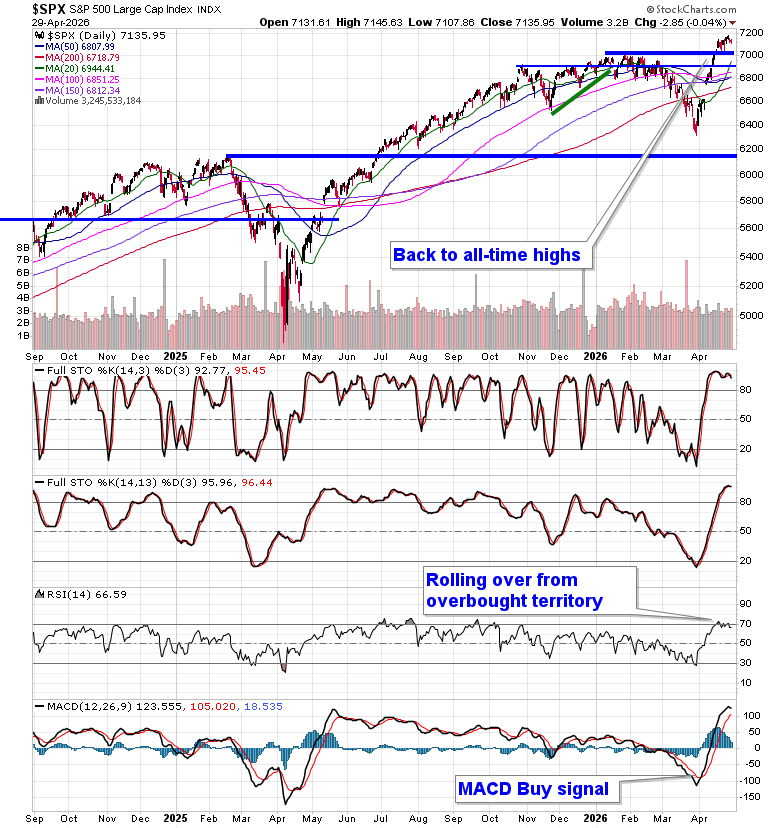
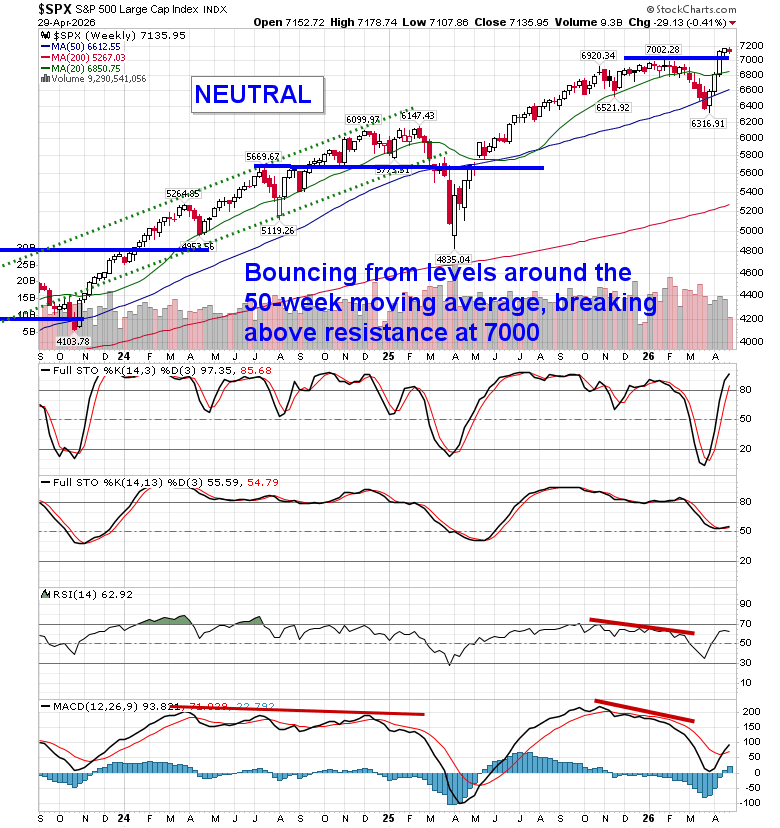
Ongoing strength in the price of oil continues to cap the near-term upside momentum in the equity market as traders hold the tape fairly steady surrounding earnings reports from a number of tech titans. The S&P 500 Index ended nearly unchanged, staying below the downside gap charted in the previous session around resistance at 7150. A number of gaps remain unfilled below, including the big one between 6620 and 6740, but, ultimately, the character of the market has changed where levels of resistance hold less weight than levels of support. Downside risks in the near-term can be pegged towards levels around 6900, but, we are still playing with a positive side bias (albeit with hedges that have been added in recent days – see our April 22 Market Outlook). Momentum indicators have been rolling over from overbought territory, highlighting upside exhaustion and lending themselves to the prospect of a digestive phase on the horizon, particularly once we get beyond the height to earnings season this week. In the Seasonal Advantage Portfolio (which is strongly higher YTD, continuing to set new high watermarks) that we manage for clients at CastleMoore, we continue to be fully exposed to risk (stocks) after flipping from our low volatility stance around the end of March and our performance is benefiting. The conflict in Iran remains a wildcard and we are running down our cues that would warrant a more defensive posture in risk assets. Subscribers can view the themes in our chart books to either Accumulate or Avoid that we continue to gear portfolios towards.
Today, in our Market Outlook to subscribers, we discuss the following:
- Market Trend & Near-Term Setup
- Oil Is the Dominant Macro Force
- US Durable Goods Orders and the investment implications within
- US Housing Starts and the trade setup that is aligning according to the three-prongs to our approach
- Energy Supply/Demand and the trades to stay on the right side of the supply dynamic
Subscribers can look for this report in their inbox or by clicking on the following link and logging in: Market Outlook for April 30
Not signed up yet? Subscribe now to receive full access to all of the research and analysis that we publish
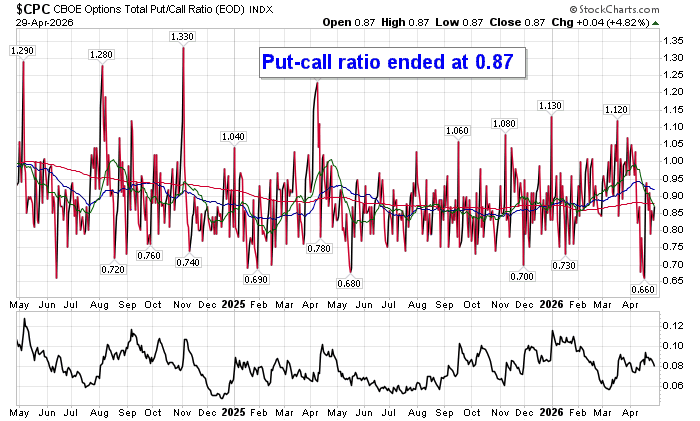
Sentiment on Wednesday, as gauged by the put-call ratio, ended bullish at 0.87.
Seasonal charts of companies reporting earnings today:


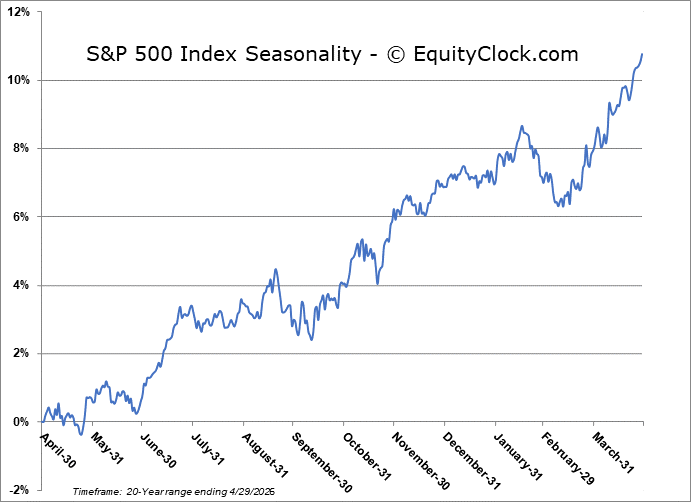
S&P 500 Index
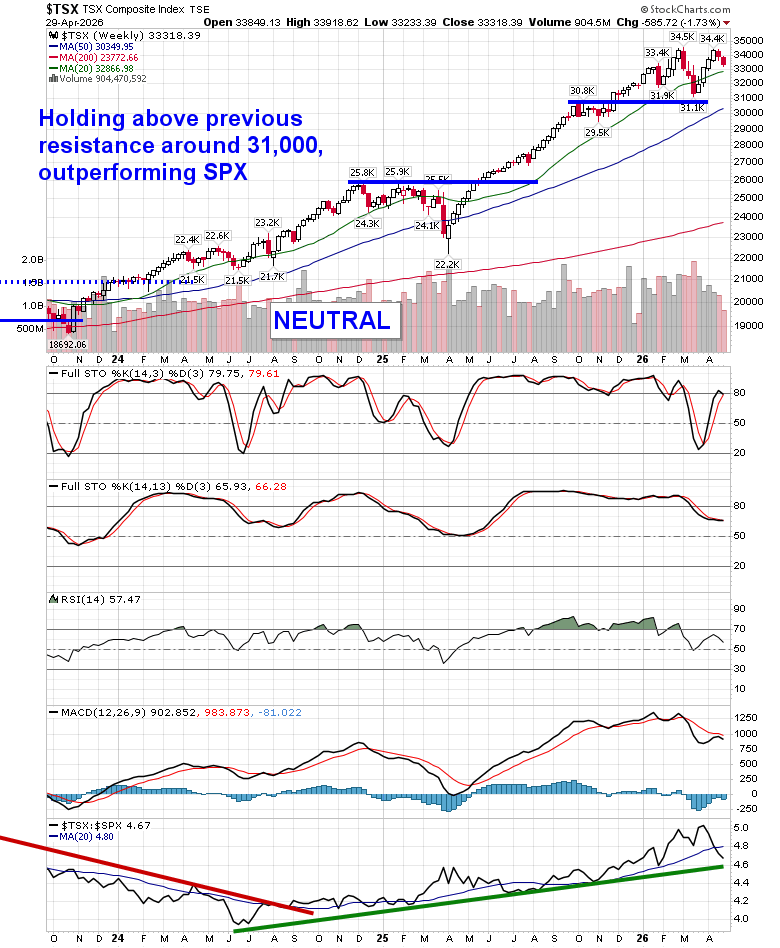
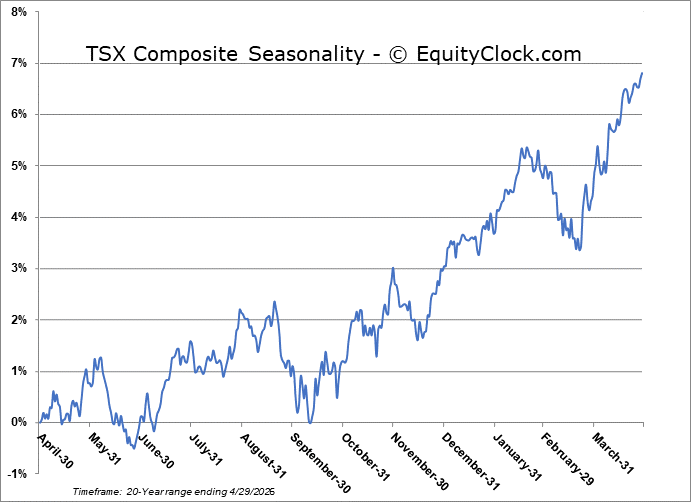
TSE Composite
| Sponsored By... |

|


