Stock Market Outlook for May 5, 2026

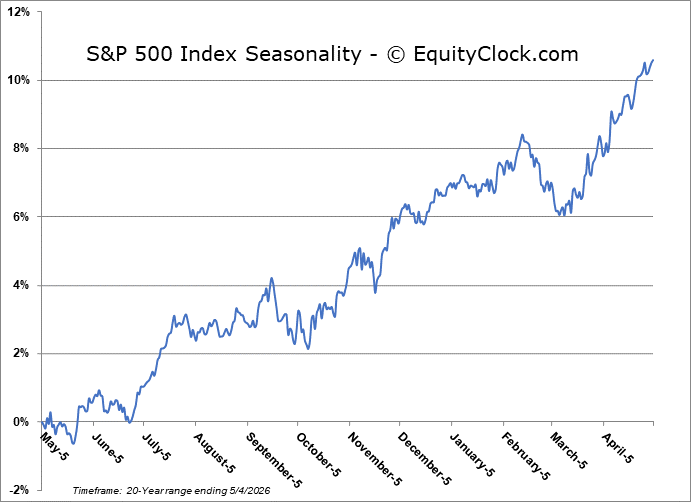
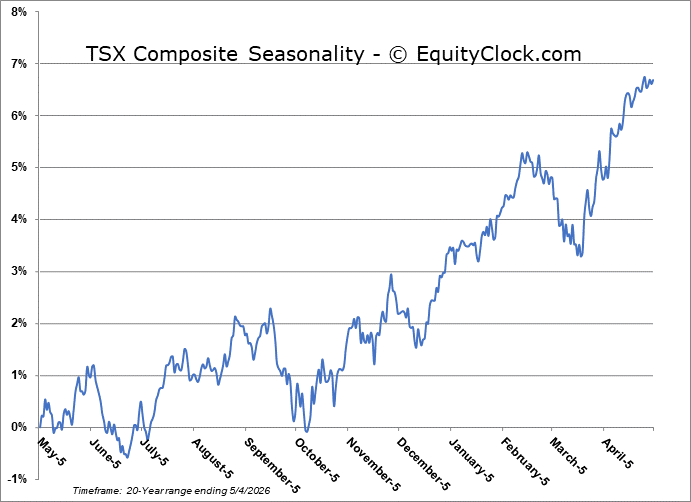
Seasonal weakness is setting in.
*** Stocks highlighted are for information purposes only and should not be considered as advice to purchase or to sell mentioned securities. As always, the use of technical and fundamental analysis is encouraged in order to fine tune entry and exit points to average seasonal trends.
Stocks Entering Period of Seasonal Strength Today:
Subscribers Click on the relevant link to view the full profile. Not a subscriber? Signup here.
Stock Highlight: |
|

Murphy Oil Corp. Holding Co. (NYSE:MUR) Seasonal Chart |
|
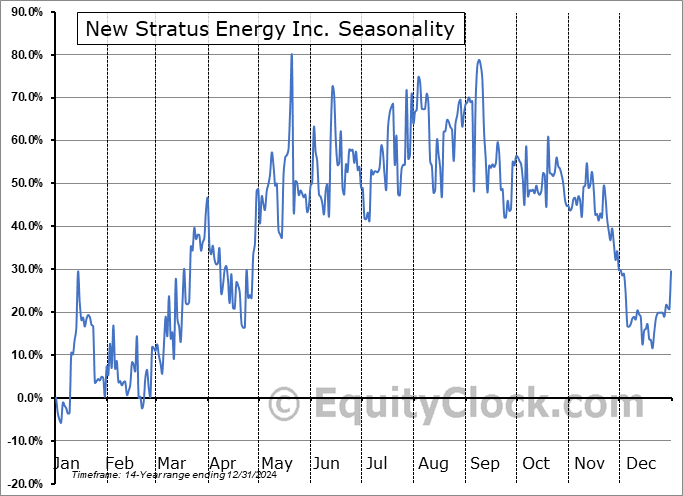
New Stratus Energy Inc. (TSXV:NSE.V) Seasonal Chart

iShares MSCI USA Momentum Factor ETF (AMEX:MTUM) Seasonal Chart
Disclaimer: Comments and opinions offered in this report are for information only. They should not be considered as advice to purchase or to sell mentioned securities. Data offered is believed to be accurate, but is not guaranteed.
The Markets
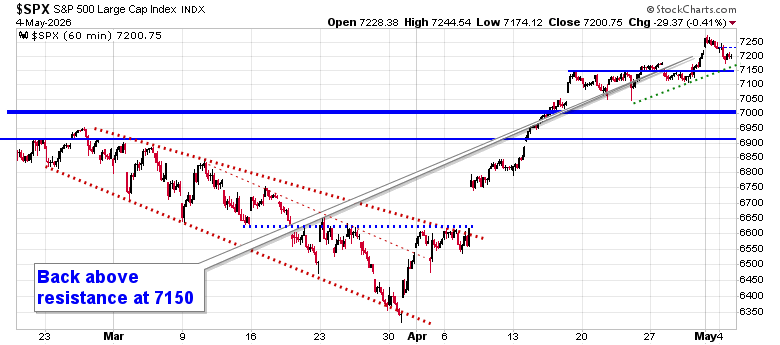
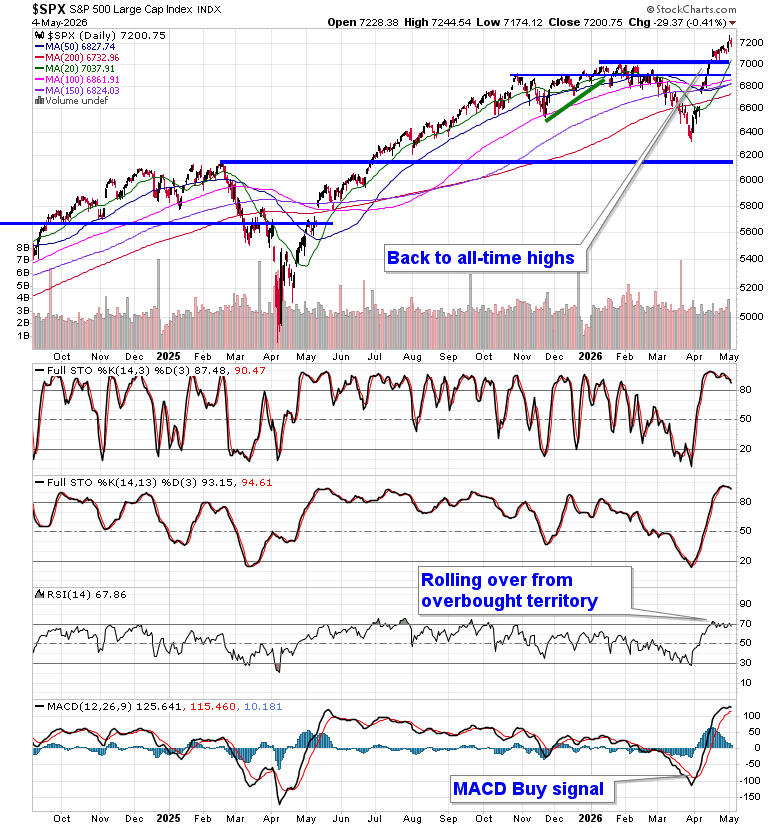
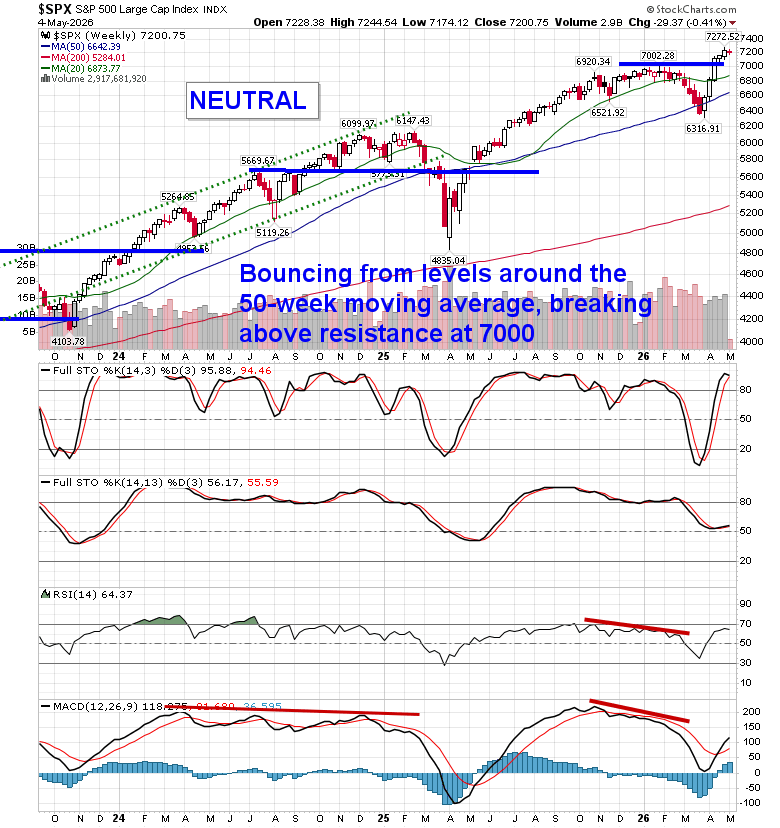
Uncertainties pertaining to the situation surrounding the Strait of Hormuz sent the price of Oil and interest rates higher on Monday, pressuring stocks in the process. The S&P 500 Index ended down by just over four-tenths of one percent, continuing to hold above resistance that the benchmark had been struggling with in recent days at 7150. A number of gaps remain unfilled below, including the big one between 6620 and 6740, but, ultimately, the character of the market has changed where levels of resistance hold less weight than levels of support. Downside risks in the near-term can be pegged towards levels around 6900, but, we are still playing with a positive side bias (albeit with hedges that have been added in recent days – see our April 22 Market Outlook). Momentum indicators have been rolling over from overbought territory, highlighting upside exhaustion and lending themselves to the prospect of a digestive phase on the horizon, particularly once we move beyond the height to earnings season. In the Seasonal Advantage Portfolio (which is strongly higher YTD, continuing to set new high watermarks) that we manage for clients at CastleMoore, we continue to be fully exposed to risk (stocks) after flipping from our low volatility stance around the end of March and our performance is benefiting (strongly outperforming the S&P 500 Index, Nasdaq Composite, and TSX Composite). The conflict in Iran remains a wildcard and we are running down our cues that would warrant a more defensive posture in risk assets. Subscribers can view the themes in our chart books to either Accumulate or Avoid that we continue to gear portfolios towards.
Want to know which areas of the market to buy or sell? Our Weekly Chart Books have just been updated, providing a clear Accumulate, Avoid, or Neutral rating for currencies, cryptocurrencies, commodities, broad markets, and subsectors/industries of the market. Subscribers can login and click on the relevant links to access.
- Currencies
- Cryptocurrencies
- Commodities
- Major Benchmarks
- Sub-sectors / Industries
- ETFs: Bonds | Commodities | Equity Markets | Industries | Sectors
Subscribe now.
Today, in our Market Outlook to subscribers, we discuss the following:
- Market Backdrop & Positioning
- Shift Toward Caution
- Key Macro Watch Variables
- Sector Rotation Underway
- New Accumulate (Buy) Themes and our entire list of Accumulate candidates
- New Avoid (Short) Areas
- Portfolio Implications
Subscribers can look for this report in their inbox or by clicking on the following link and logging in: Market Outlook for May 5
Not signed up yet? Subscribe now to receive full access to all of the research and analysis that we publish
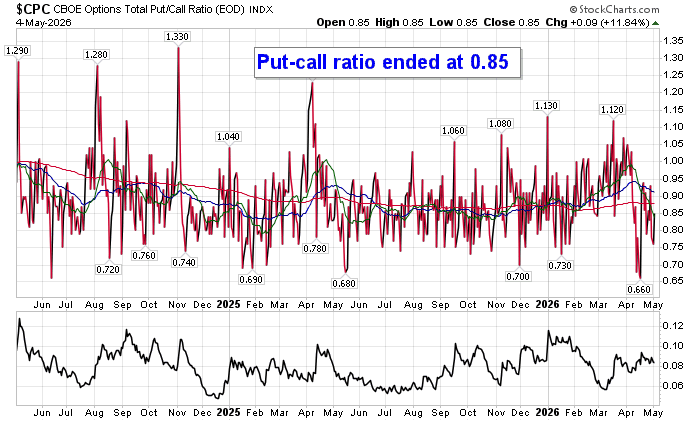
Sentiment on Monday, as gauged by the put-call ratio, ended bullish at 0.85.
Seasonal charts of companies reporting earnings today:


S&P 500 Index
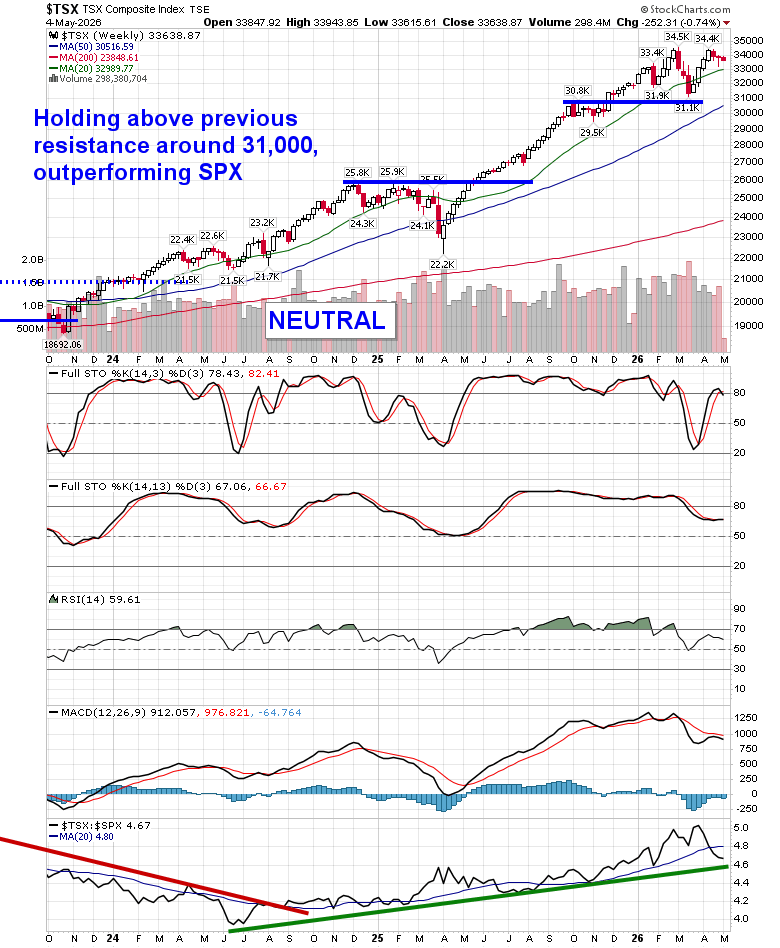
TSE Composite
| Sponsored By... |

|


