Stock Market Outlook for June 17, 2026

Outside reversal candlesticks in a key Technology subsector highlight upside exhaustion.
*** Stocks highlighted are for information purposes only and should not be considered as advice to purchase or to sell mentioned securities. As always, the use of technical and fundamental analysis is encouraged in order to fine tune entry and exit points to average seasonal trends.
Stocks Entering Period of Seasonal Strength Today:
Subscribers Click on the relevant link to view the full profile. Not a subscriber? Signup here.
Stock Highlight: |
|

Bird Construction Inc. (TSE:BDT.TO) Seasonal Chart |
|

LKQ Corp. (NASD:LKQ) Seasonal Chart

Federal Realty Investment Trust (NYSE:FRT) Seasonal Chart

Navios Maritime Partners L.P. (NYSE:NMM) Seasonal Chart

Duluth Holdings Inc. (NASD:DLTH) Seasonal Chart

Cmb.Tech NV (NYSE:CMBT) Seasonal Chart

Ovid Therapeutics Inc. (NASD:OVID) Seasonal Chart

Schneider National, Inc. (NYSE:SNDR) Seasonal Chart
Disclaimer: Comments and opinions offered in this report are for information only. They should not be considered as advice to purchase or to sell mentioned securities. Data offered is believed to be accurate, but is not guaranteed.
The Markets
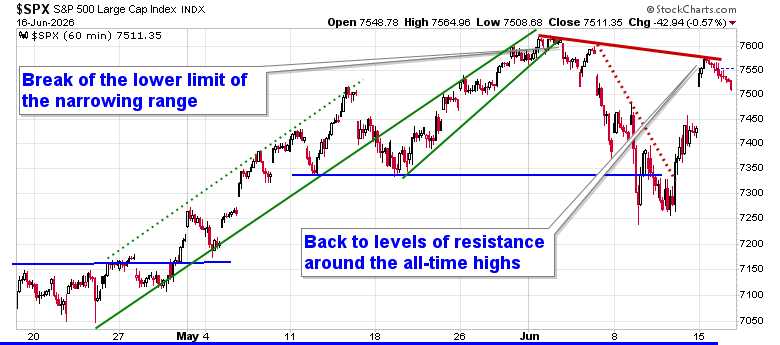
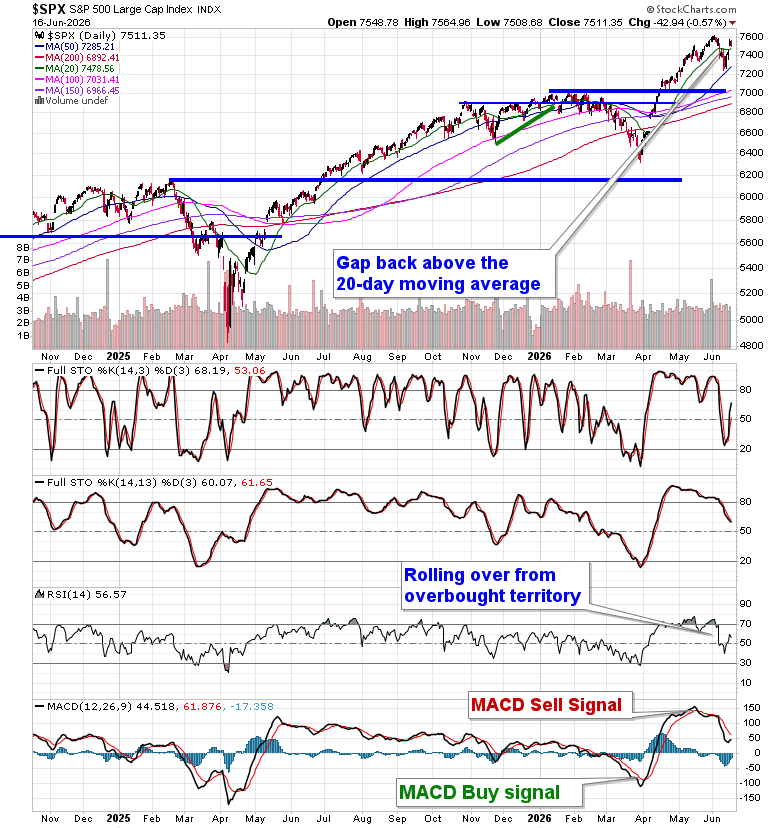
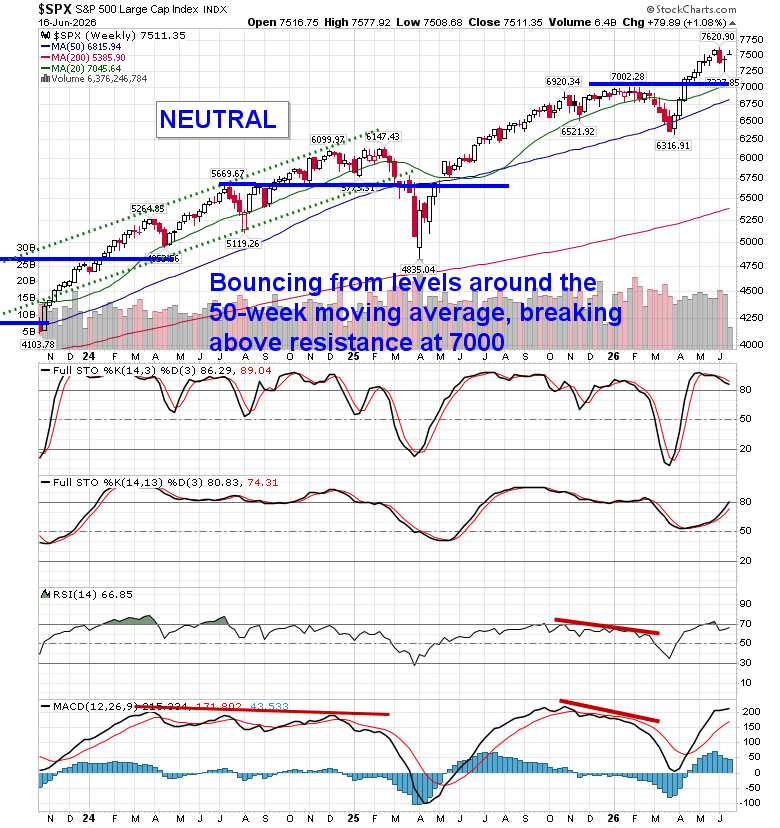
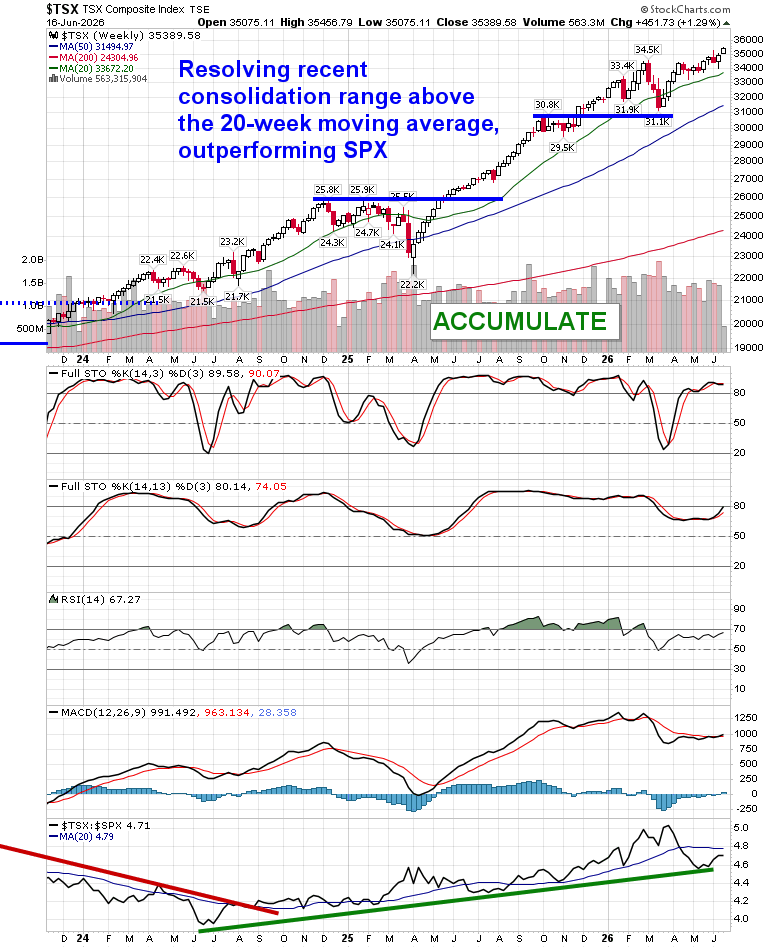
Stocks gave back some of the strength that they entered the week with as the resumption of mean reversion in some of the year-to-date winners took a toll on the Technology sector. The S&P 500 Index shed around six-tenths of one percent, starting to close some of the upside gap that was charted on Monday, a zone that we are monitoring for evidence of support. Intermediate-term support at the 50-day moving average at 7285 has stood in the way of a more detrimental digestion of early year strength, coinciding with end of quarter rebalancing. In the Seasonal Advantage Portfolio that we manage for clients at CastleMoore, we remain positioned for a more volatile/risk-off market framework and we have managed to stay afloat in both positive and negative sessions this month, generating significant alpha in the process. The state of the energy market and corresponding impact on the cost of borrowing/value of the dollar are the ongoing wildcards, but we have been positioning based on what is tangible, rather than speculation on what may result. Subscribers can view the themes in our chart books to either Accumulate or Avoid that we continue to gear portfolios towards.
Today, in our Market Outlook to subscribers, we discuss the following:
- Market Rotation
- Upside exhaustion in a key Technology subsector
- Growth over Value
- US Industrial Production and the investment implications within
- US Housing Starts and how to position around the weak housing market
Subscribers can look for this report in their inbox or by clicking on the following link and logging in: Market Outlook for June 17
Not signed up yet? Subscribe now to receive full access to all of the research and analysis that we publish
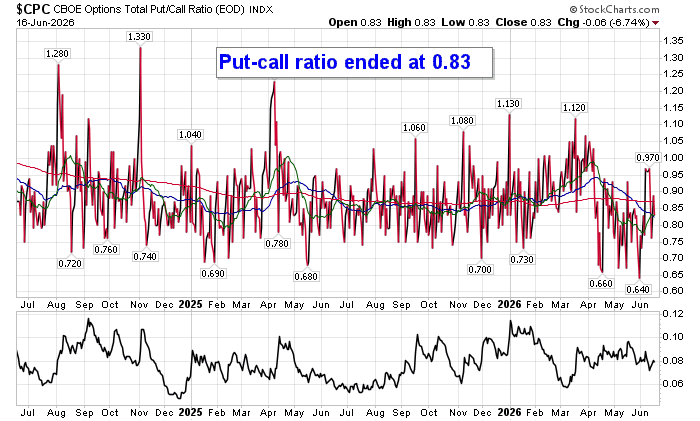
Sentiment on Tuesday, as gauged by the put-call ratio, ended bullish at 0.83.
Seasonal charts of companies reporting earnings today:


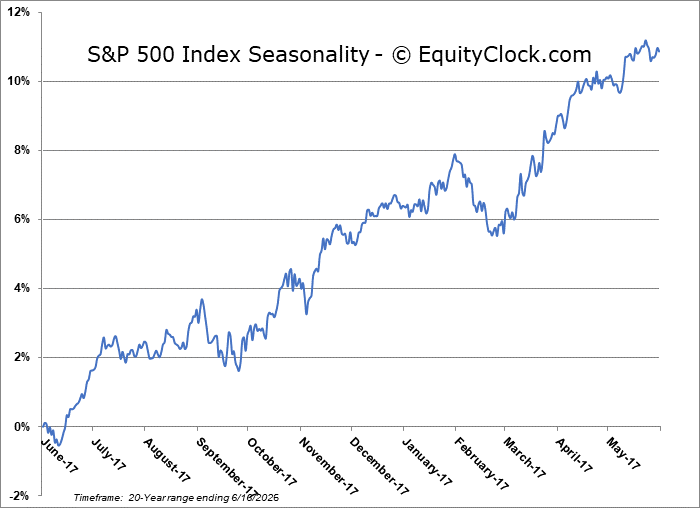
S&P 500 Index
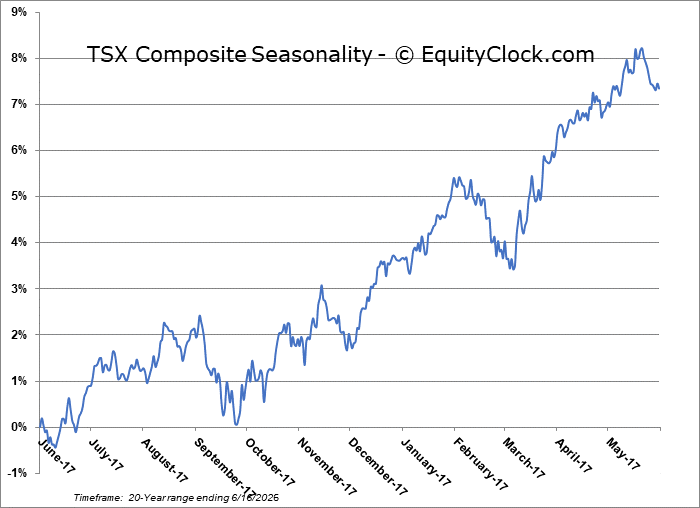
TSE Composite
| Sponsored By... |

|


