Stock Market Outlook for June 25, 2026

The conditions are improving for the pending summer rally period.
*** Stocks highlighted are for information purposes only and should not be considered as advice to purchase or to sell mentioned securities. As always, the use of technical and fundamental analysis is encouraged in order to fine tune entry and exit points to average seasonal trends.
Stocks Entering Period of Seasonal Strength Today:
Subscribers Click on the relevant link to view the full profile. Not a subscriber? Signup here.
Stock Highlight: |
|
|
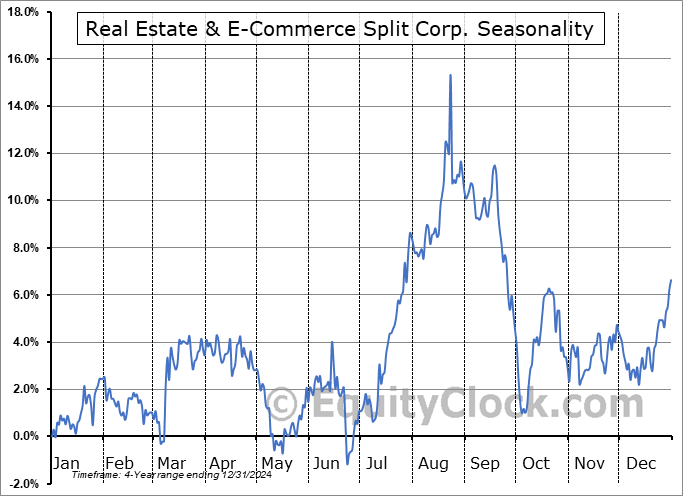
Real Estate & E-Commerce Split Corp. (TSE:RS.TO) Seasonal Chart |
|

CNB Financial Corp. (NASD:CCNE) Seasonal Chart

United Rentals, Inc. (NYSE:URI) Seasonal Chart

Standex Intl Corp. (NYSE:SXI) Seasonal Chart

Franklin Electric Co., Inc. (NASD:FELE) Seasonal Chart

Packaging Corp Of America (NYSE:PKG) Seasonal Chart
Disclaimer: Comments and opinions offered in this report are for information only. They should not be considered as advice to purchase or to sell mentioned securities. Data offered is believed to be accurate, but is not guaranteed.
The Markets
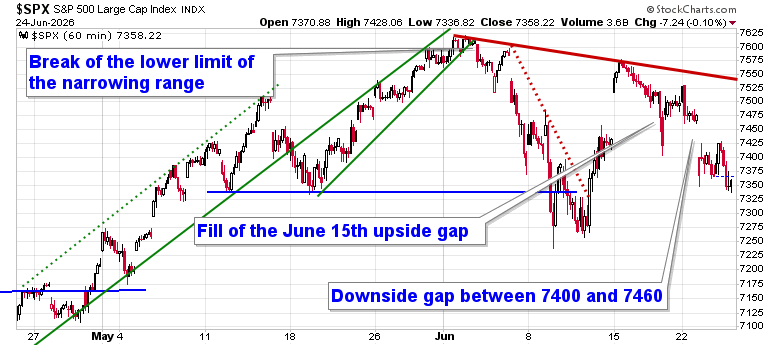
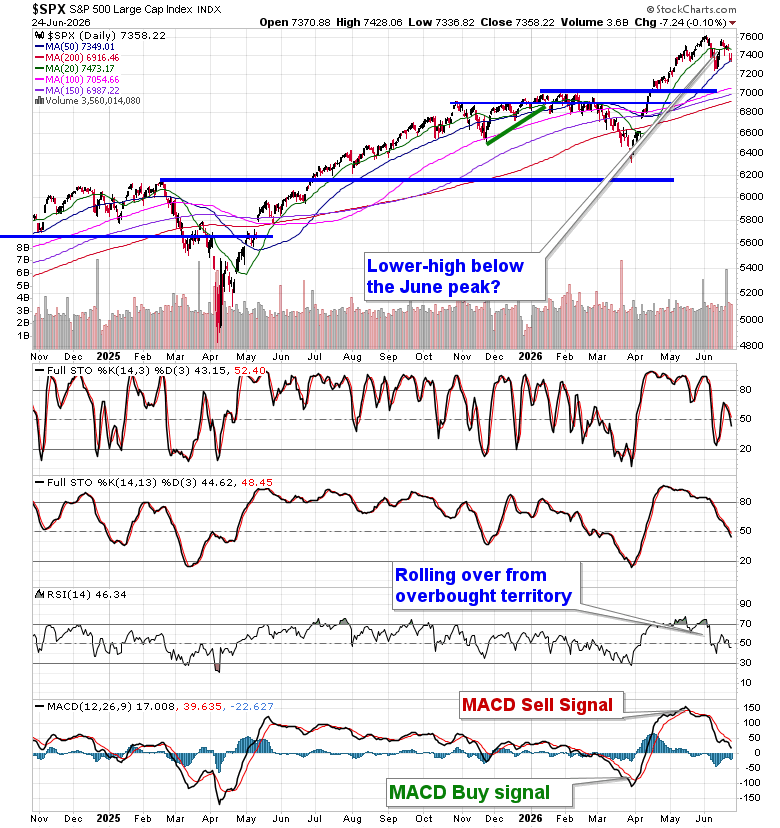
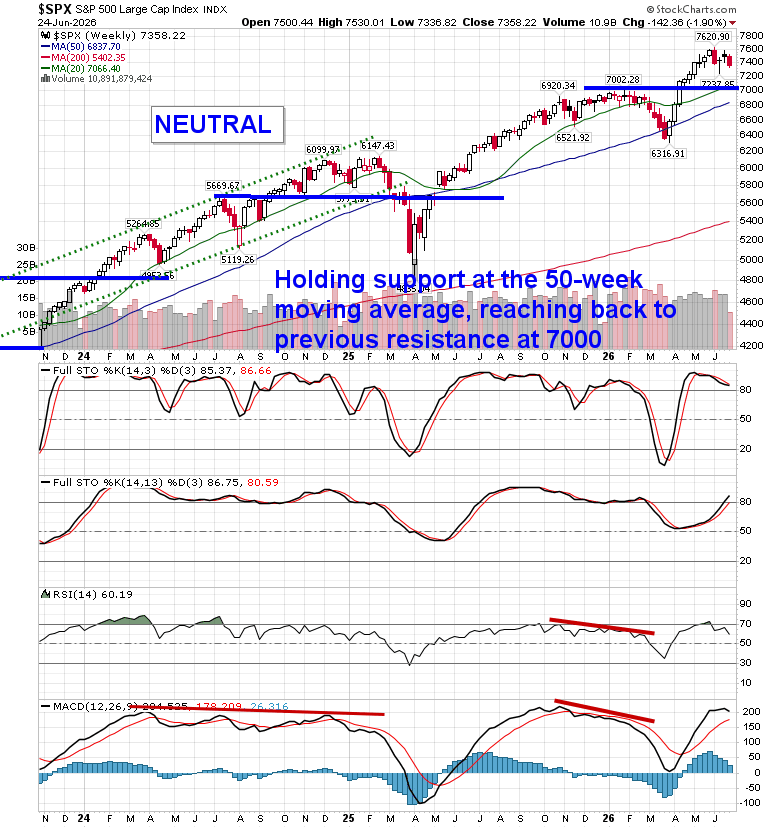
Ongoing rotation in the market ahead of the end of the quarter resulted in further selling pressures for stocks. The S&P 500 Index slipped by a tenth of one percent after failing to close the downside gap that was opened on Tuesday. The gap between 7400 and 7460 defines another barrier overhead for the benchmark to contend with. The ultra-short-term trend of the benchmark still shows lower-lows and lower-highs for the month of June, a notoriously mean reverting month that tends to result in a digestion of early year gains. Intermediate-term support at the 50-day moving average at 7349 is being pressured, attempting to stand in the way of a more detrimental digestion of early year strength, coinciding with end of quarter rebalancing. The appearance of a lower short-term high below the early June peak keeps our downside risk target of 7000 (previous horizontal resistance) on the table. Daily momentum indicators have been negatively diverging from price, emphasizing the upside exhaustion/digestion that the price action has portrayed in recent weeks. In the Seasonal Advantage Portfolio that we manage for clients at CastleMoore, we remain positioned for this more volatile/risk-off market framework and we chose not to react to the positivity that the market had shown early last week that was pushing back against our thesis of how the market was to perform in this last month of the quarter (eg. digestion of early year gains). The state of the energy market and the impact of the cost of borrowing/value of the dollar remain key risks to the market, something that continues to be scrutinized. Subscribers can view the themes in our chart books to either Accumulate or Avoid that we continue to gear portfolios towards.
Today, in our Market Outlook to subscribers, we discuss the following:
- The rise in the US Dollar and decline in the Cryptocurrency market: Targets on where each may be heading
- US New Home Sales and the fundamental cloud over home building stocks
- The drop in yields and rally in bond prices on Wednesday
- Oil reaching back to the open gap charted amidst the start of the conflict with Iran
- Energy market fundamentals
Subscribers can look for this report in their inbox or by clicking on the following link and logging in: Market Outlook for June 25
Not signed up yet? Subscribe now to receive full access to all of the research and analysis that we publish
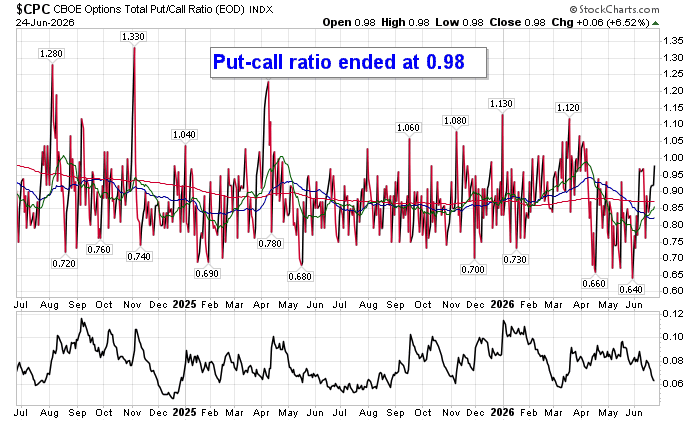
Sentiment on Wednesday, as gauged by the put-call ratio, ended close to neutral at 0.98.
Seasonal charts of companies reporting earnings today:


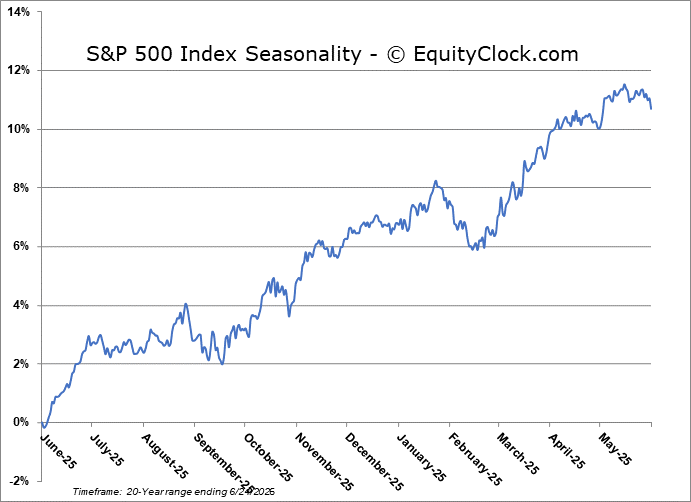
S&P 500 Index
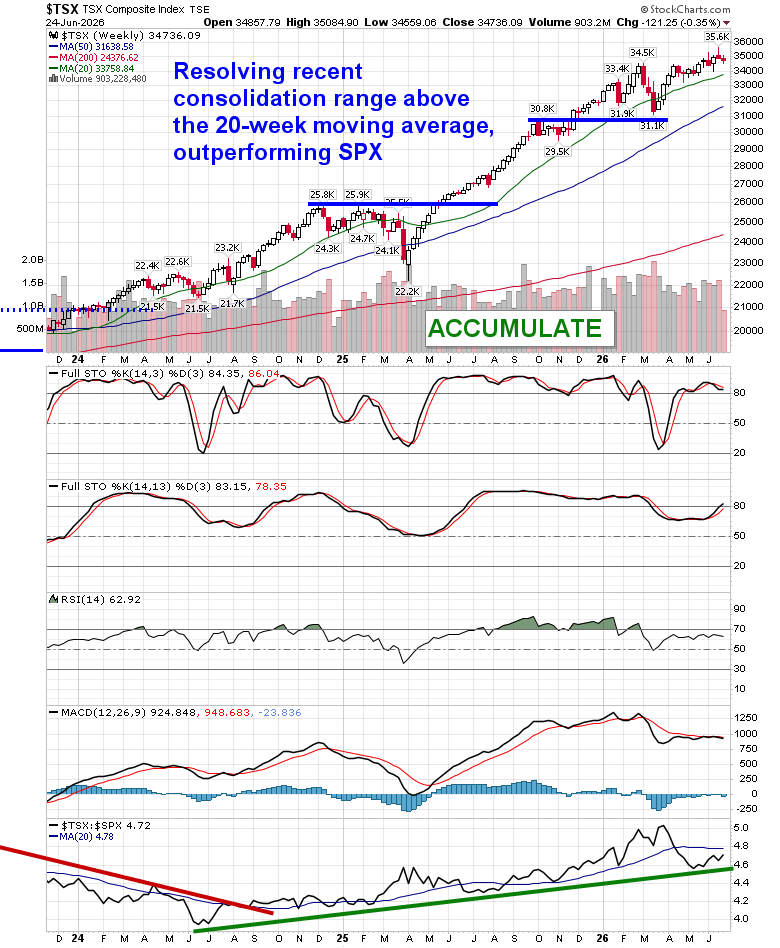
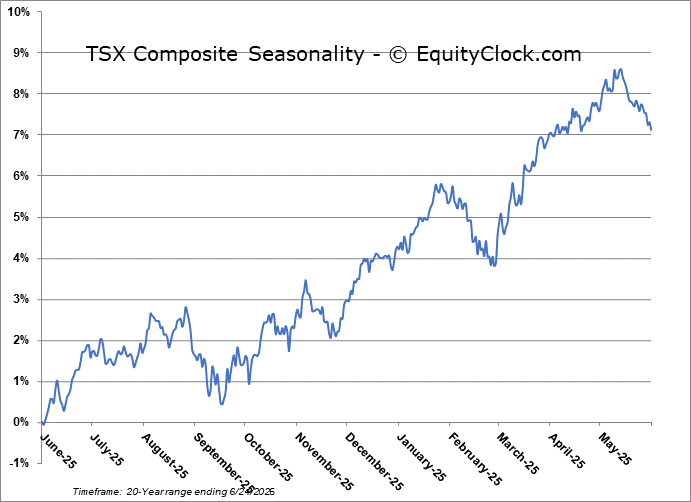
TSE Composite
| Sponsored By... |

|


