Stock Market Outlook for July 16, 2026

Duelling head-and-shoulders patterns in the Technology sector.
*** Stocks highlighted are for information purposes only and should not be considered as advice to purchase or to sell mentioned securities. As always, the use of technical and fundamental analysis is encouraged in order to fine tune entry and exit points to average seasonal trends.
Stocks Entering Period of Seasonal Strength Today:
Subscribers Click on the relevant link to view the full profile. Not a subscriber? Signup here.
Stock Highlight: |
|

PrairieSky Royalty Ltd. (TSE:PSK.TO) Seasonal Chart |
|

Mid Penn Bancorp (NASD:MPB) Seasonal Chart

Red Violet, Inc. (NASD:RDVT) Seasonal Chart

VanEck Oil Refiners ETF (AMEX:CRAK) Seasonal Chart

Exchange Income Corp. (TSE:EIF.TO) Seasonal Chart

iShares Equal Weight Banc & Lifeco ETF (TSE:CEW.TO) Seasonal Chart

Under Armour, Inc. (NYSE:UAA) Seasonal Chart
Disclaimer: Comments and opinions offered in this report are for information only. They should not be considered as advice to purchase or to sell mentioned securities. Data offered is believed to be accurate, but is not guaranteed.
The Markets
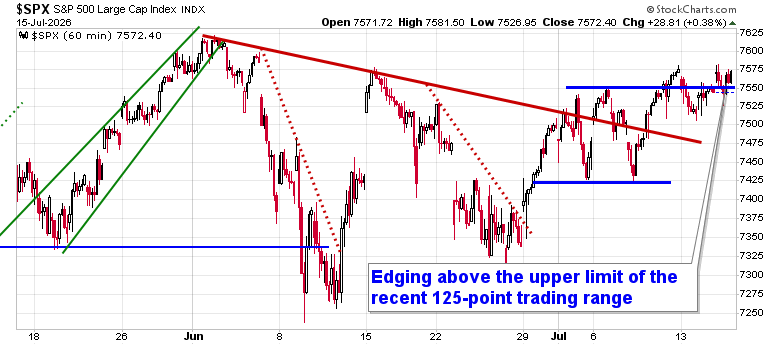
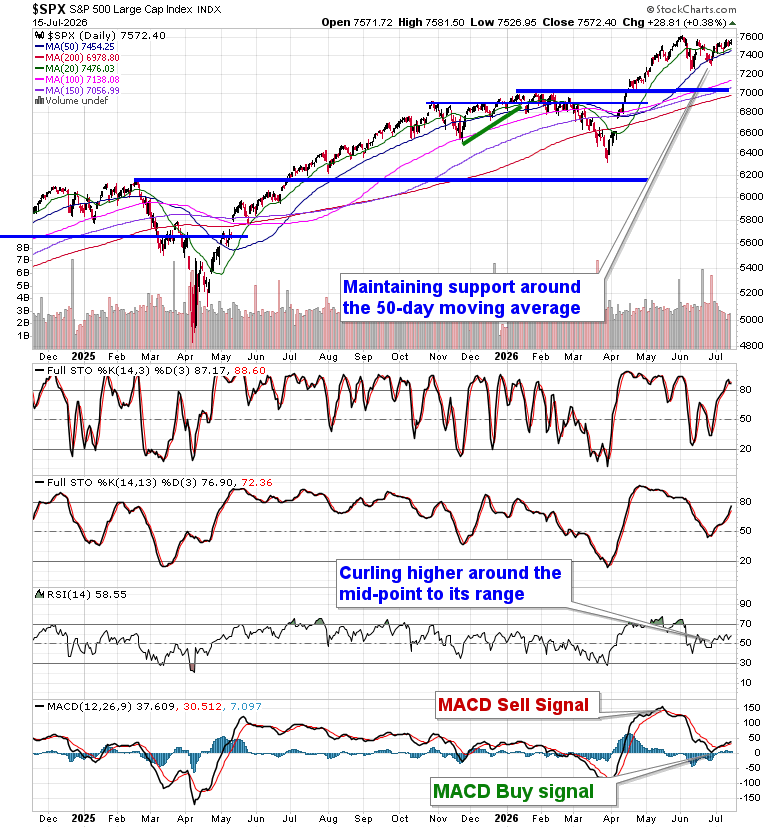
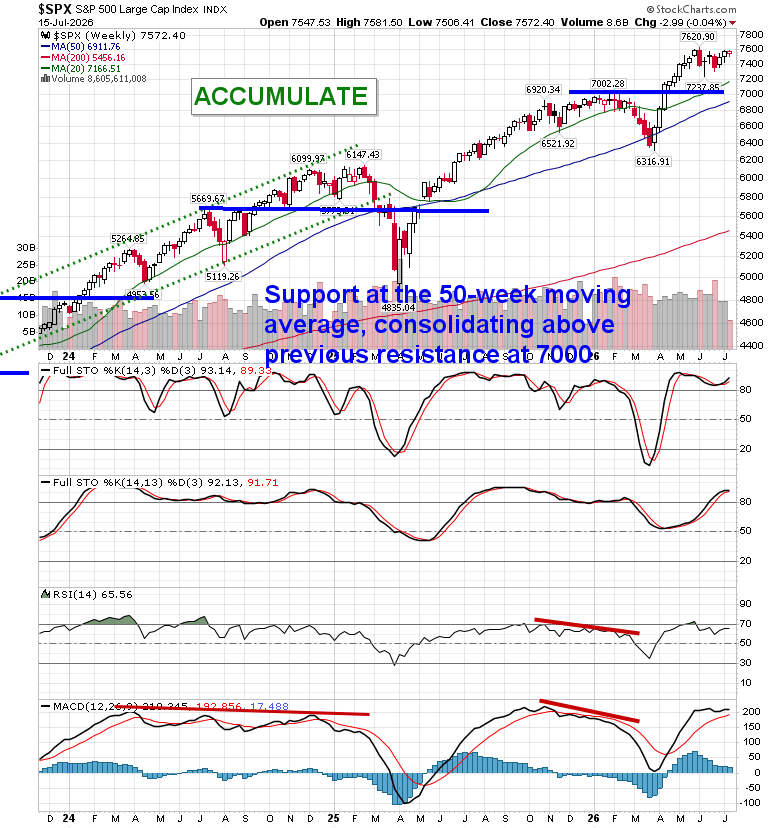
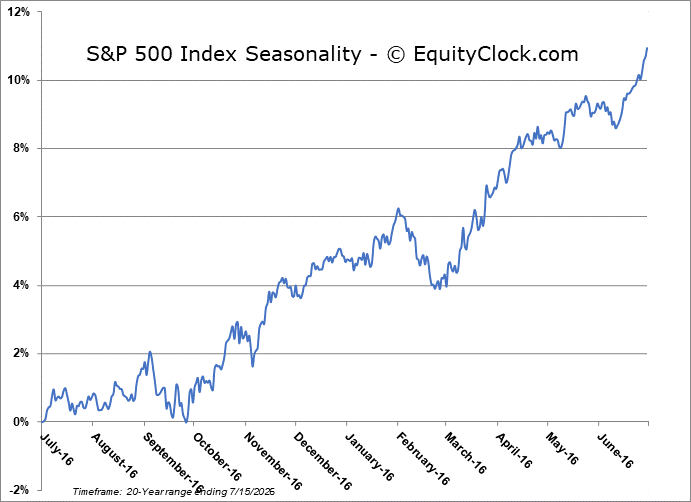
Stocks showed mixed performance on Wednesday as two growth sectors (Technology and Communication Services) moved in opposite directions. The S&P 500 Index gained nearly four-tenths of one percent, inching above short-term trading range resistance at 7550. The resolution of the recent horizontal range continues to project a move towards 7675. Support on the daily chart is being maintained at 20 and 50-day moving averages (~7454), which have converged on one another in a bearish manner. Daily momentum indicators curled higher at the start of the month, triggering near-term buy signals that aligned nicely with the start of the summer rally phase, but they are starting to show sluggish performance as investors digest the geopolitical risks. In the Seasonal Advantage Portfolio that we manage for clients at CastleMoore, we remain positioned for this summer rally phase that began on June 27th (S&P 500 Index is strongly higher, above the seasonal norm, since that point). Following a first half performance in the Seasonal Advantage Portfolio that was well ahead of our own benchmark (as well as all major equity benchmarks in the market), we are still anticipating strength for the start of the second half of the year, but we are scrutinizing the risks that have abruptly escalated with the increase in geopolitical tensions. The start of earnings season provides some cover to the headline threats. Subscribers can view what we are targeting in our list of market segments to either Accumulate or Avoid.
Today, in our Market Outlook to subscribers, we discuss the following:
- Duelling head-and-shoulders patterns in the Technology sector: What segments of the market are at risk and which are presenting the opportunities
- Triangle consolidation pattern on the NASDAQ 100 ETF (QQQ)
- US Producer Price Index (PPI) and the investment implications within
- Inflation protection
- Canada Manufacturing Sales
Subscribers can look for this report in their inbox or by clicking on the following link and logging in: Market Outlook for July 16
Not signed up yet? Subscribe now to receive full access to all of the research and analysis that we publish
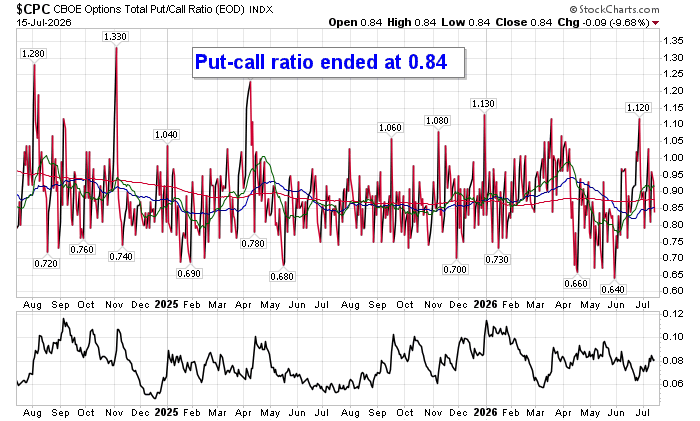
Sentiment on Wednesday, as gauged by the put-call ratio, ended bullish at 0.84.
Seasonal charts of companies reporting earnings today:


S&P 500 Index
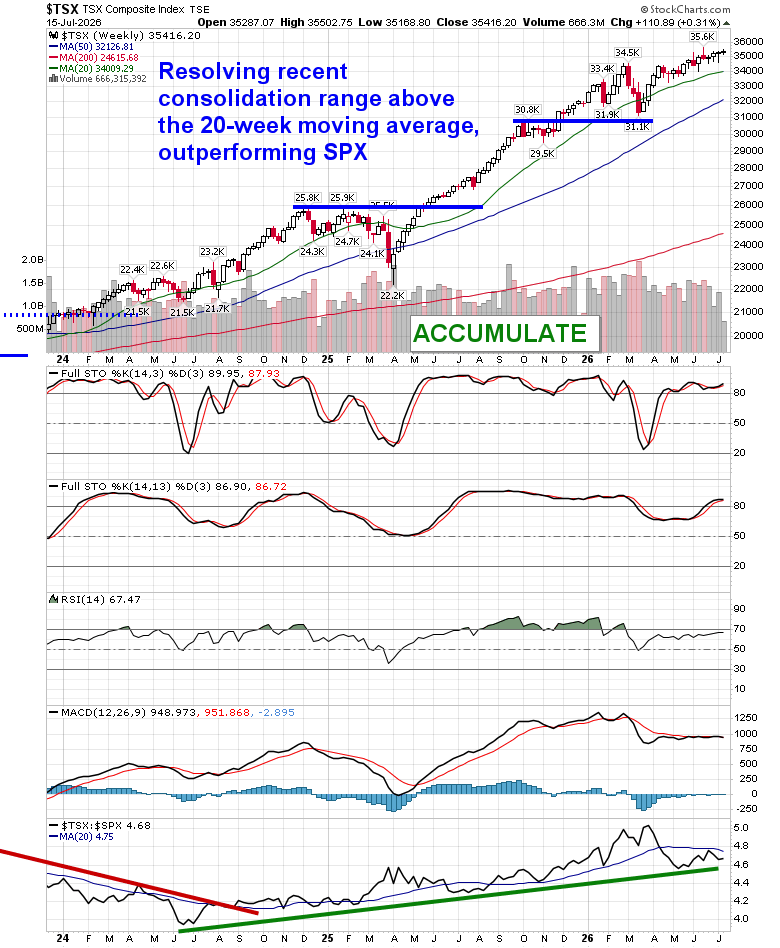
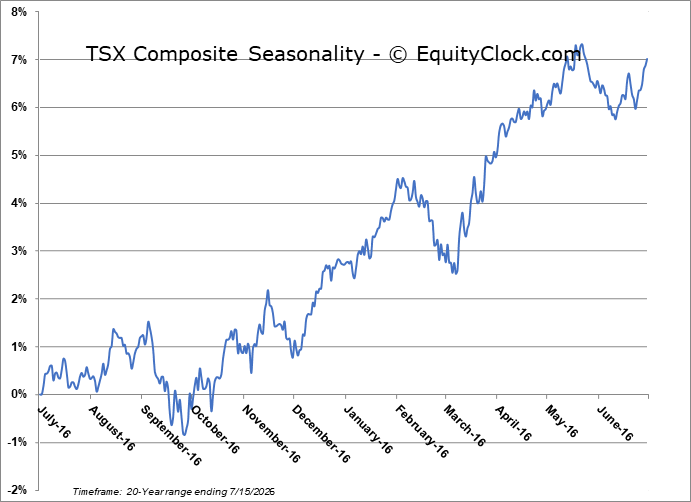
TSE Composite
| Sponsored By... |

|


