Stock Market Outlook for October 12, 2026

Should investors expect a 20% drawdown in stocks similar to the fourth quarter of 2018 during Trump’s first term around the mid-term election?
*** Stocks highlighted are for information purposes only and should not be considered as advice to purchase or to sell mentioned securities. As always, the use of technical and fundamental analysis is encouraged in order to fine tune entry and exit points to average seasonal trends.
Stocks Entering Period of Seasonal Strength Today:
Subscribers Click on the relevant link to view the full profile. Not a subscriber? Signup here.
Stock Highlight: |
|

Walt Disney Co. (NYSE:DIS) Seasonal Chart |
|

Wyndham Hotels & Resorts, Inc. (NYSE:WH) Seasonal Chart

Patterson-UTI Energy, Inc. (NASD:PTEN) Seasonal Chart

Parker Hannifin Corp. (NYSE:PH) Seasonal Chart

Helen of Troy Ltd. (NASD:HELE) Seasonal Chart

Hyatt Hotels Corp. (NYSE:H) Seasonal Chart

Loews Corp. (NYSE:L) Seasonal Chart

Spotify Technology S.A. (NYSE:SPOT) Seasonal Chart

Vishay Intertech, Inc. (NYSE:VSH) Seasonal Chart
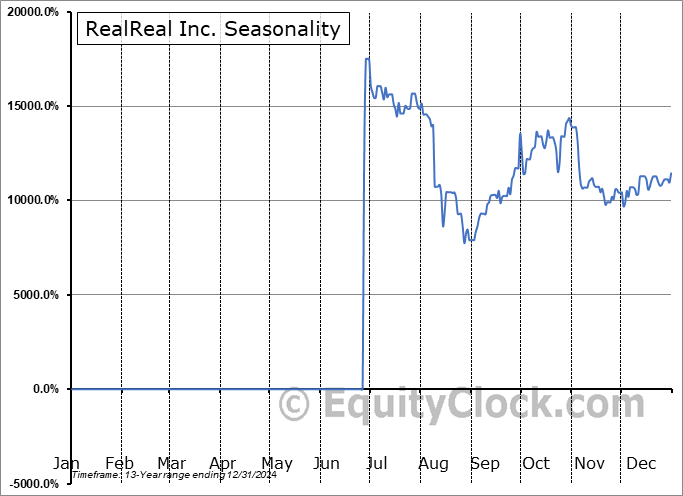
RealReal Inc. (NASD:REAL) Seasonal Chart

Mistras Group Inc. (NYSE:MG) Seasonal Chart
Disclaimer: Comments and opinions offered in this report are for information only. They should not be considered as advice to purchase or to sell mentioned securities. Data offered is believed to be accurate, but is not guaranteed.
Note: Due to a competing obligation, no report will be provided over the weekend (Saturday). Our next report, including our chart books update, will be released on Monday, October 12.
The Markets
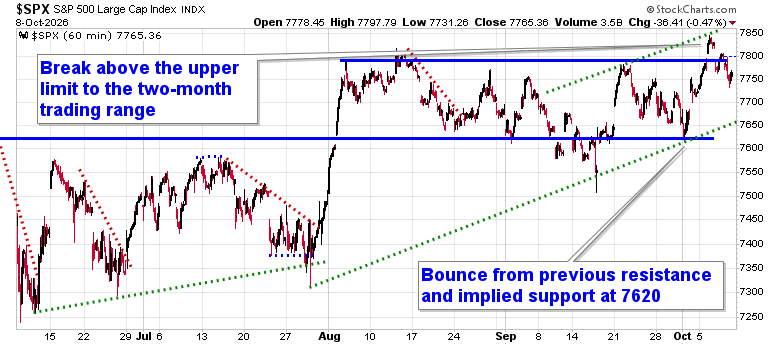
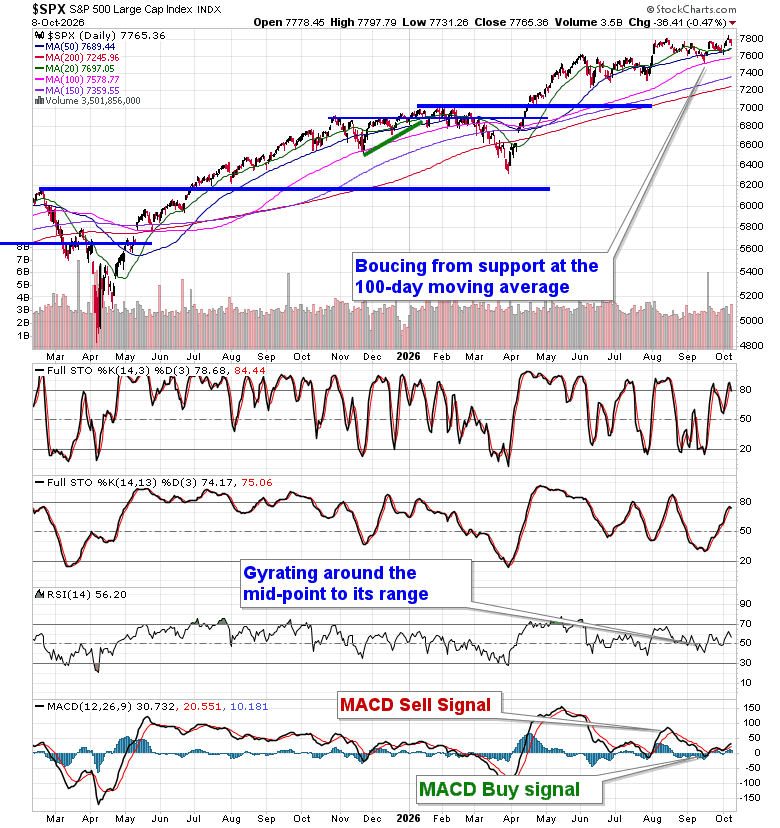
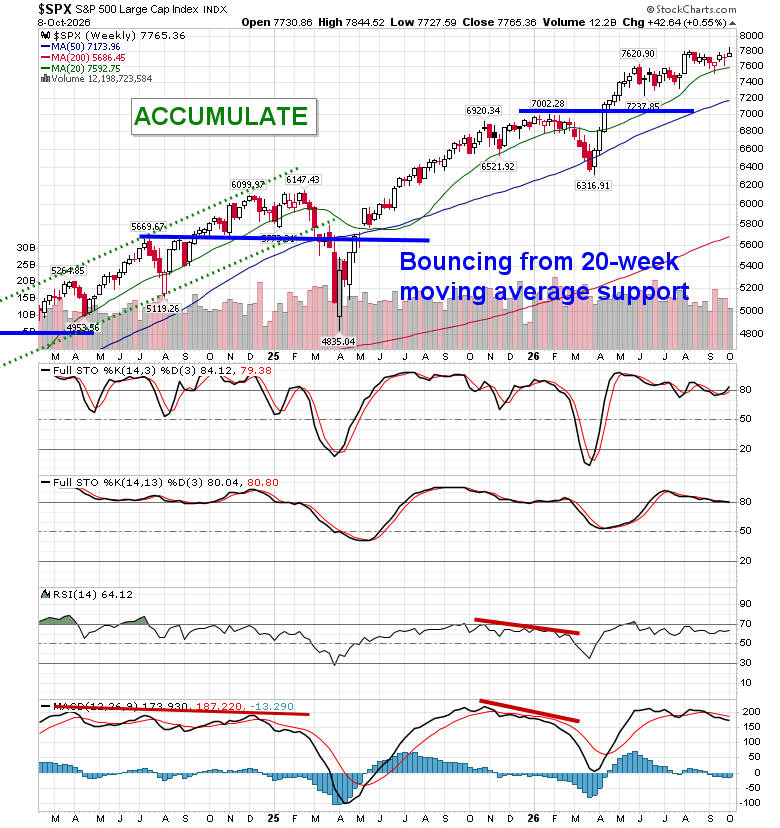
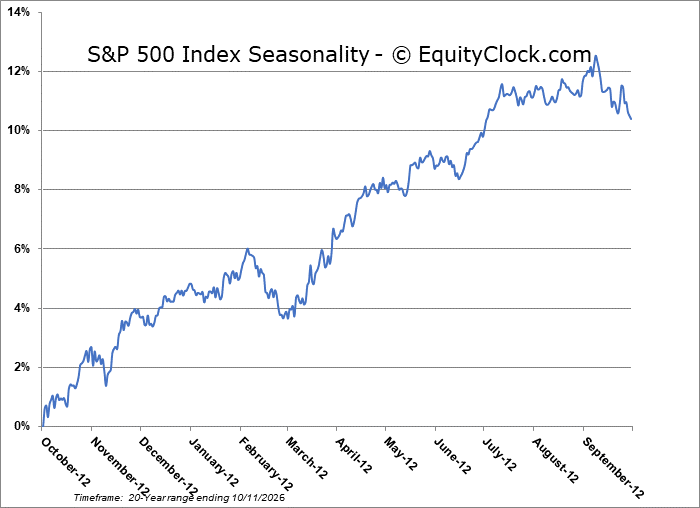
Stocks slipped on Thursday as concerns surrounding the health of the AI buildout and an escalation of geopolitical tensions (juicing the price of Oil) had investors reconsidering their exposure. The S&P 500 Index ended down by less than half of one percent, still gyrating around the upper limit of the range that the benchmark has been in since August between 7620 and 7800; so far we have not observed evidence of previous resistance acting as support. The upper bound (7800) has formed the basis of the neckline to a head-and-shoulders pattern, a bullish setup that could see a resolution towards 8000. An ultra-short-term trend of higher-highs and higher-lows can be picked out, bound by a an approximately 200-point rising trading range that currently derives its lower limit at 7650. The daily chart shows support at the 50 and 100-day moving averages, a violation of which would be required to deem a shift of trajectory. While beyond what has historically been the weakest two-week stretch of the year at the end of September, volatility in the market tends to remain heightened into the month of October, therefore caution has been appropriate, but we have been pushing back against the negativity that is typical for this timeframe (see our September 18th report). We continue to examine what may be the appropriate stance in equity positioning for the month of October, but we did start to de-risk recently in our Super Simple Seasonal Portfolio (trimming our commodity/oil exposure). Subscribers can stay on top of our thinking and what we are watching in our regular reports, as well as view what we are targeting in our list of market segments to either Accumulate or Avoid.
Today, in our Market Outlook to subscribers, we discuss the following:
- Underperformance of Small Caps and Banks
- Consumer Staples bouncing precisely from support; what we like in this defensive group
- Comparing the market today to the backdrop we had in 2018 (during Trump’s first term) that led to 20% correction during the fourth quarter
- Gold
- Oil
- The seasonal trade in Natural Gas
- Weekly Jobless Claims and the health of the labor market
- Additional Thoughts
Subscribers can look for this report in their inbox or by clicking on the following link and logging in: Market Outlook for October 12
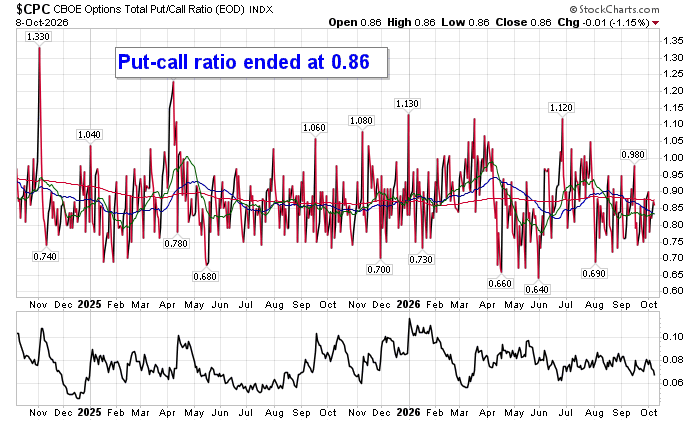
Sentiment on Thursday, as gauged by the put-call ratio, ended bullish at 0.86.
Seasonal charts of companies reporting earnings today:

S&P 500 Index
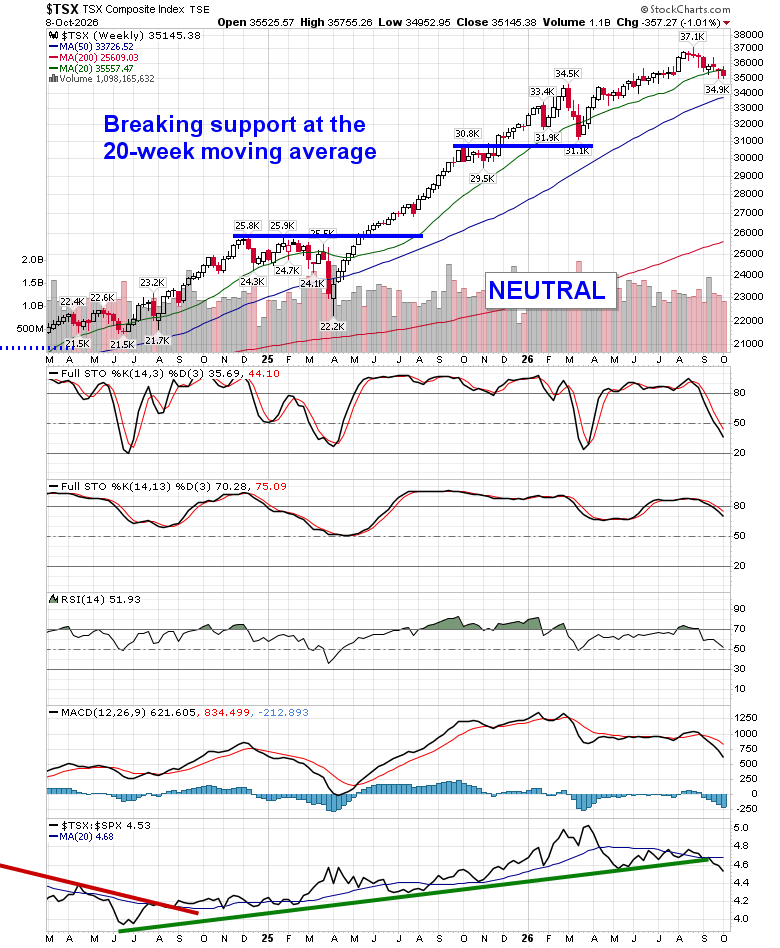
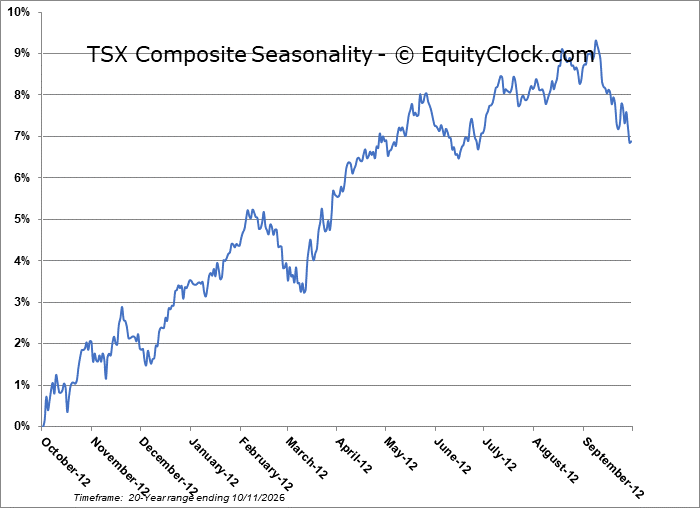
TSE Composite
| Sponsored By... |

|


