Stock Market Outlook for November 5, 2026

Running down the cues and the setups following the midterm election result.
*** Stocks highlighted are for information purposes only and should not be considered as advice to purchase or to sell mentioned securities. As always, the use of technical and fundamental analysis is encouraged in order to fine tune entry and exit points to average seasonal trends.
Stocks Entering Period of Seasonal Strength Today:
Subscribers Click on the relevant link to view the full profile. Not a subscriber? Signup here.
Stock Highlight: |
|

Viatris Inc. (NASD:VTRS) Seasonal Chart |
|

Fiserv, Inc. (NASD:FISV) Seasonal Chart

ACI Worldwide Inc. (NASD:ACIW) Seasonal Chart

Teradata Corp. (NYSE:TDC) Seasonal Chart

Teva Pharmaceutical Industries Ltd. (NYSE:TEVA) Seasonal Chart
Disclaimer: Comments and opinions offered in this report are for information only. They should not be considered as advice to purchase or to sell mentioned securities. Data offered is believed to be accurate, but is not guaranteed.
The Markets
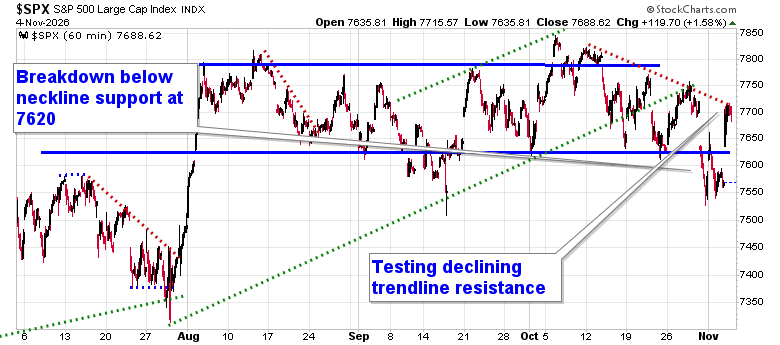
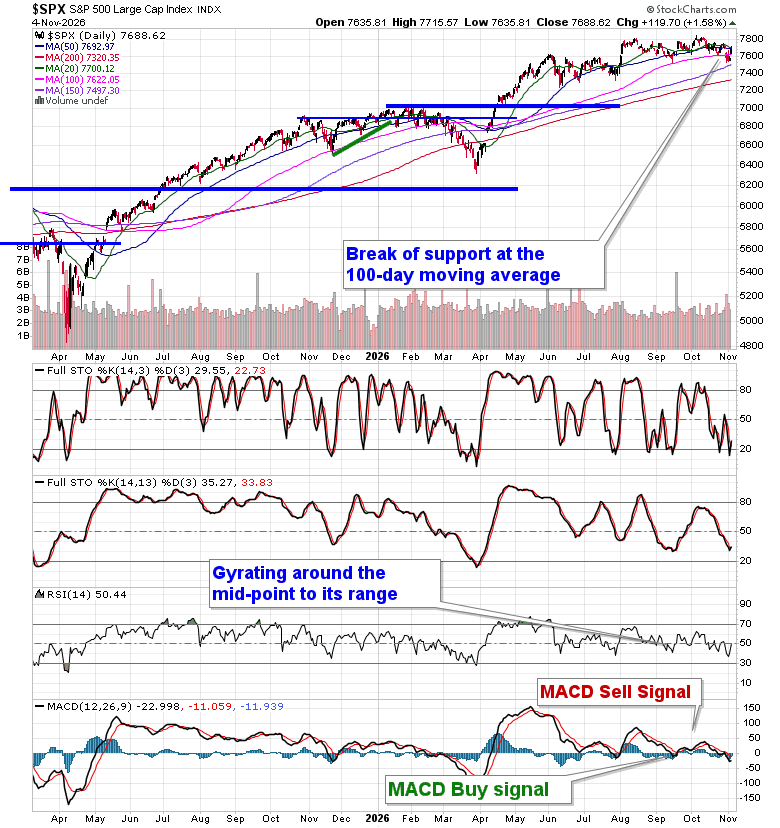
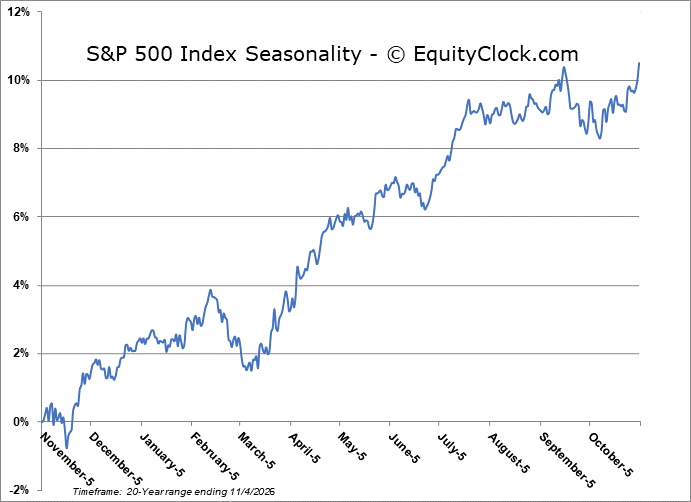
Stocks rallied following the outcome of the midterm election amidst a plunge in the price of Oil and speculation on the various measures a Democratic congress will bring to the economy in the next couple of years. The S&P 500 Index jumped by 1.58%, reaching back and reacting to declining trendline resistance from the past month around 7700. A gap back above the lower limit of the trading range between 7620 and 7800 dampens the bearish setup that has been highlighted recently, but the market needs to break this recent path of lower-highs and lower-lows to put the ball back into the bull’s court. 20 and 50-day moving averages are no longer defining support and remain in a position of resistance. As noted in our recent chart books, there are segments following recent price action that we no longer want to be exposed to, but the market has provided rotation opportunities that allow us to maintain our overall equity exposure. Members can stay on top of our thinking and what we are watching in our regular reports, as well as view what we are targeting in our list of market segments to either Accumulate or Avoid
Today, in our Market Outlook to subscribers, we discuss the following:
- Consumer Stocks: Relief Rally
- Potential Opportunities: Depressed Market Segments
- Interest Rates, Dollar & Credit: Remaining Headwinds
- Risk Appetite: High Beta Still Lagging
- Cryptocurrency: Potential Risk-On Confirmation
- Oil & Energy: Lower Prices Support Stocks
Subscribers can look for this report in their inbox or by clicking on the following link and logging in: Market Outlook for November 5
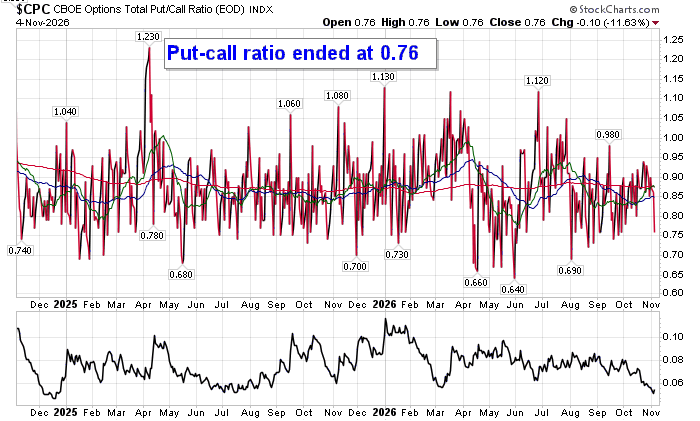
Sentiment on Wednesday, as gauged by the put-call ratio, ended bullish at 0.76.
Seasonal charts of companies reporting earnings today:


S&P 500 Index
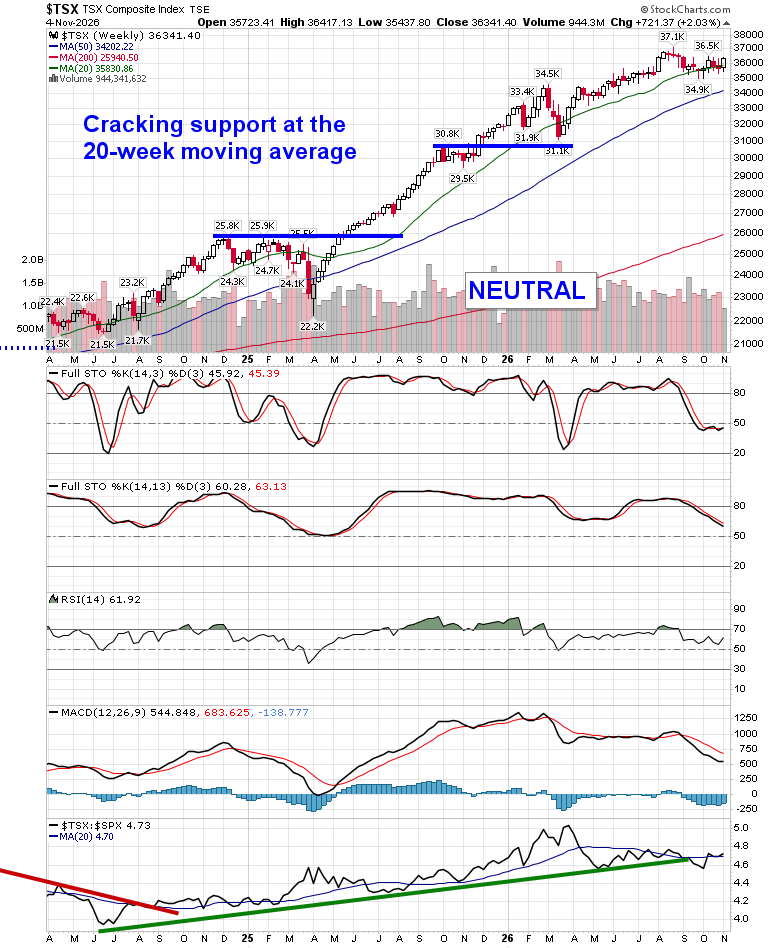
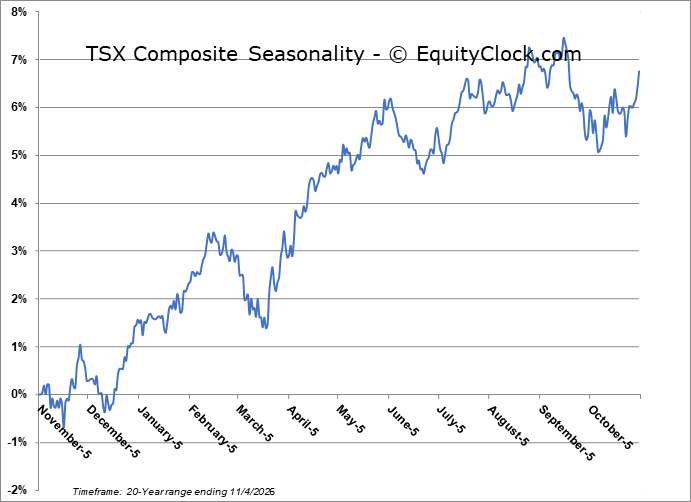
TSE Composite
| Sponsored By... |

|


