Stock Market Outlook for November 2, 2026

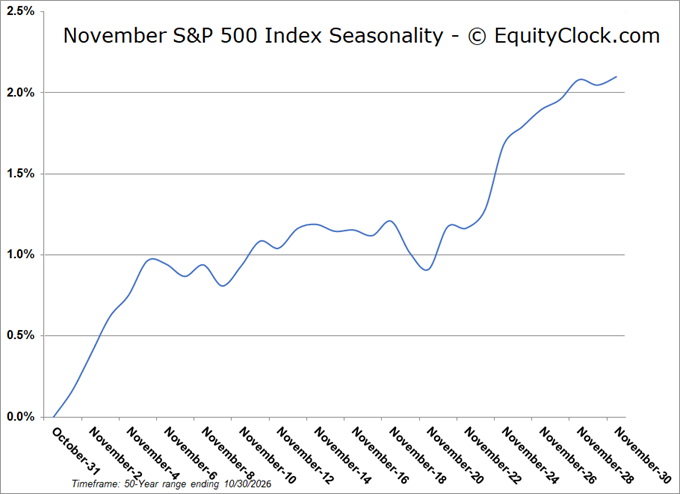
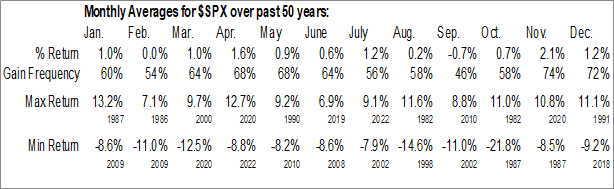
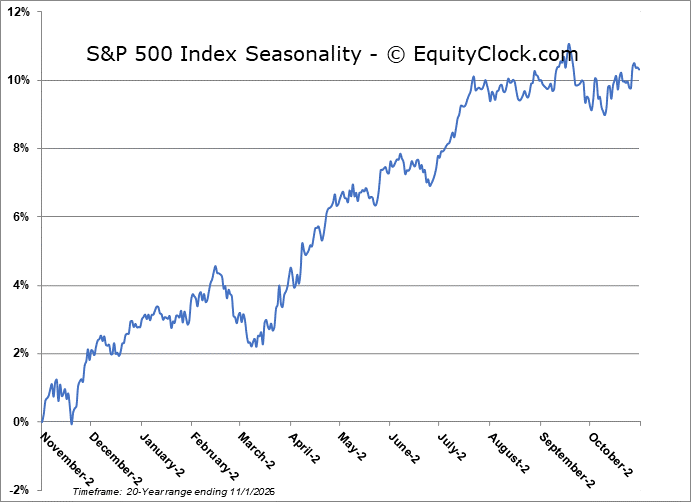
The S&P 500 Index has averaged a return of 2.1% in November with positive results realized 74% of the time over the past 50 years.
*** Stocks highlighted are for information purposes only and should not be considered as advice to purchase or to sell mentioned securities. As always, the use of technical and fundamental analysis is encouraged in order to fine tune entry and exit points to average seasonal trends.
Stocks Entering Period of Seasonal Strength Today:
Subscribers Click on the relevant link to view the full profile. Not a subscriber? Signup here.

Vanguard Industrials ETF (NYSE:VIS) Seasonal Chart

Invesco Dynamic Pharmaceuticals ETF (NYSE:PJP) Seasonal Chart

Centene Corp. (NYSE:CNC) Seasonal Chart

Align Technology, Inc. (NASD:ALGN) Seasonal Chart

QUALCOMM Inc. (NASD:QCOM) Seasonal Chart

Quantum Corp. (NASD:QMCO) Seasonal Chart

Super Micro Computer, Inc (NASD:SMCI) Seasonal Chart

Microchip Technology Inc. (NASD:MCHP) Seasonal Chart
Disclaimer: Comments and opinions offered in this report are for information only. They should not be considered as advice to purchase or to sell mentioned securities. Data offered is believed to be accurate, but is not guaranteed.
The Markets
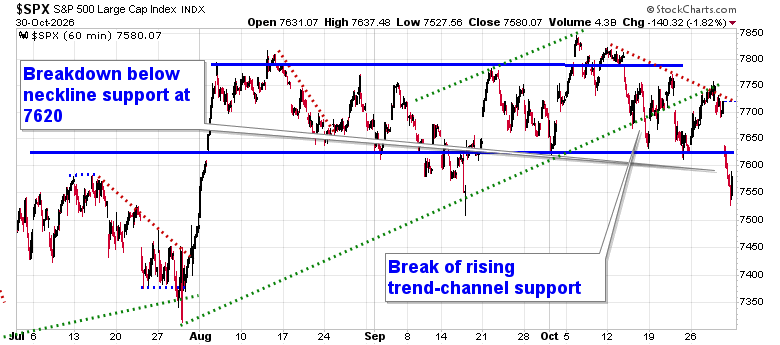
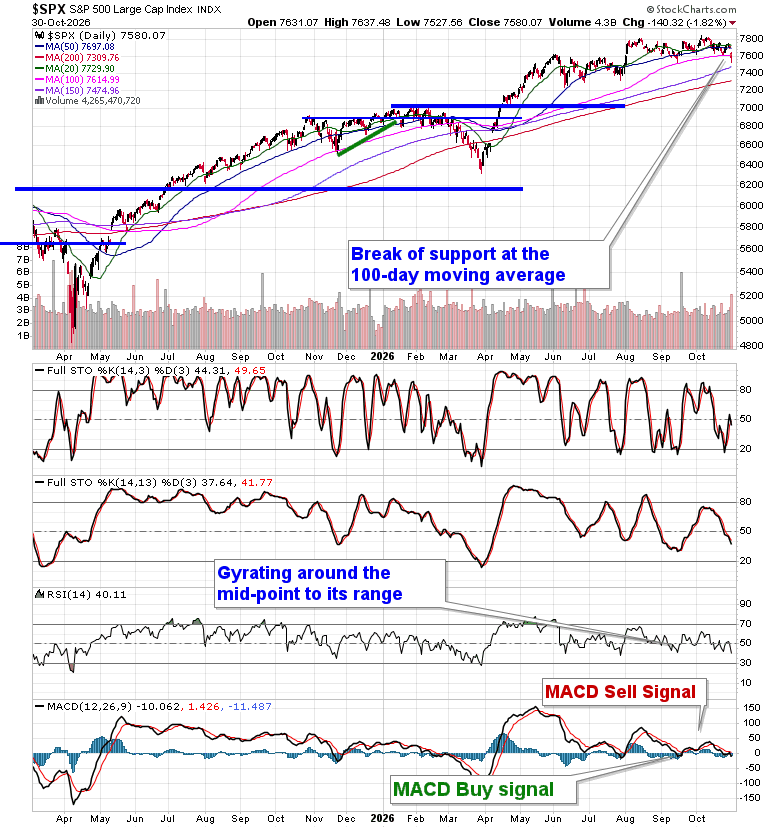
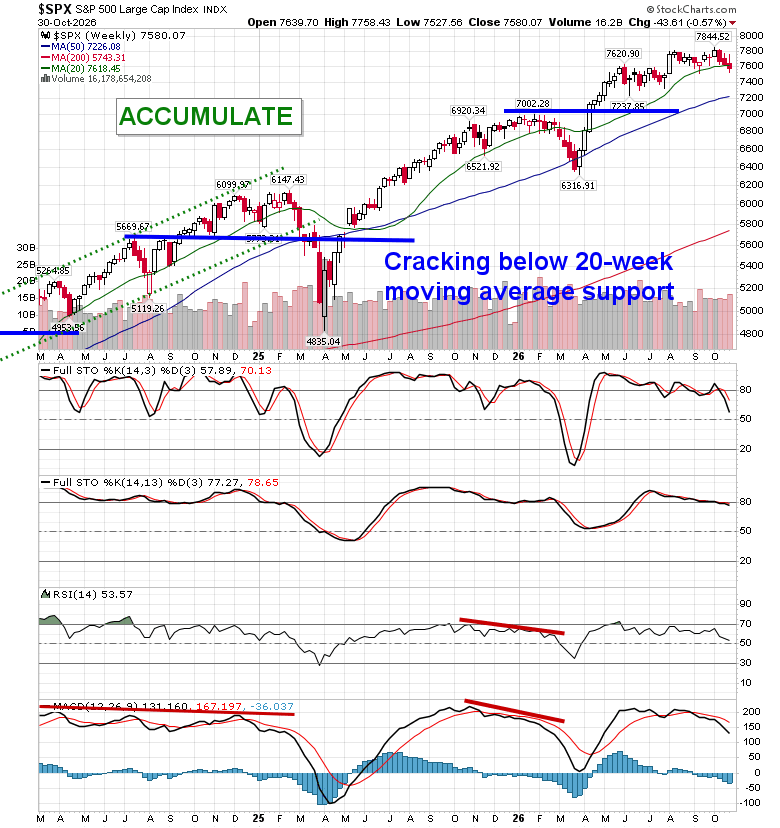
Panic in the Technology sector sent broad market benchmarks lower to end the final session of October. The S&P 500 Index declined by 1.82%, breaking below the multi-month trading range between 7620 and 7800. The lower limit of the span represented the neckline of a head-and-shoulders pattern on the hourly chart, a bearish setup that projects a theoretical downside target of 7400, or back to levels around the summer lows. The sloppiness of the tape in recent weeks and the concerns that the credit market were showing suggested that the market was vulnerable, despite being at a major turning point in the seasonal timeline from weakness to strength in stocks for the next six months. 20 and 50-day moving averages are no longer defining support and, for the first time since March, the benchmark is trading below its 100-day moving average. As noted in our recent chart books, there are segments following recent price action that we no longer want to be exposed to, but the market has provided rotation opportunities that allow us to maintain our overall equity exposure. Members can stay on top of our thinking and what we are watching in our regular reports, as well as view what we are targeting in our list of market segments to either Accumulate or Avoid
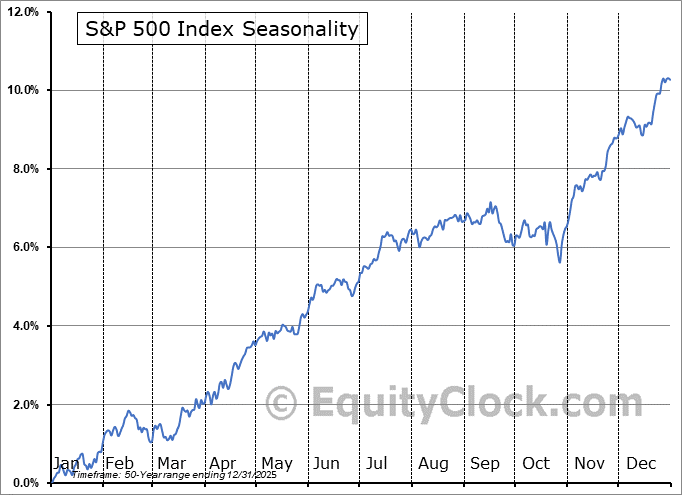
For the month ahead, as the best six months for stocks begins, November provides a good jump out of the gate. The S&P 500 Index has averaged a return of 2.1% in this second to last month of the year over the past 50 years. The result is the strongest average monthly return of the year. The frequency of positive results for the month sits at 74%. Returns have ranged from a loss of 8.5% in November of 1987 to a gain of 10.8% in November of 2020. Similar to October, gains tend to be dominated by the first few days and the last few days of the month as investors jockey for position around month-ends. The period surrounding the US Thanksgiving holiday particularly tends to see upbeat performance as investors adopt a relatively jovial sentiment and managers take vacations, thereby limiting negative bets ahead of the month of December. Strength continues through the last month of the year, finally peaking at the start of January when trading returns to normal following the holidays.
Just Released…
Our monthly report for November is out, providing you with everything that you need to know to navigate the market through the month(s) ahead.
Highlights in this report include:
- Equity market tendencies in the month of November
- Strongest period for stocks of the 4-year election cycle
- Lack of enticement to buy ahead of the Mid-Term Election
- Volatility on the Rise
- The Phantom Weight on Stocks
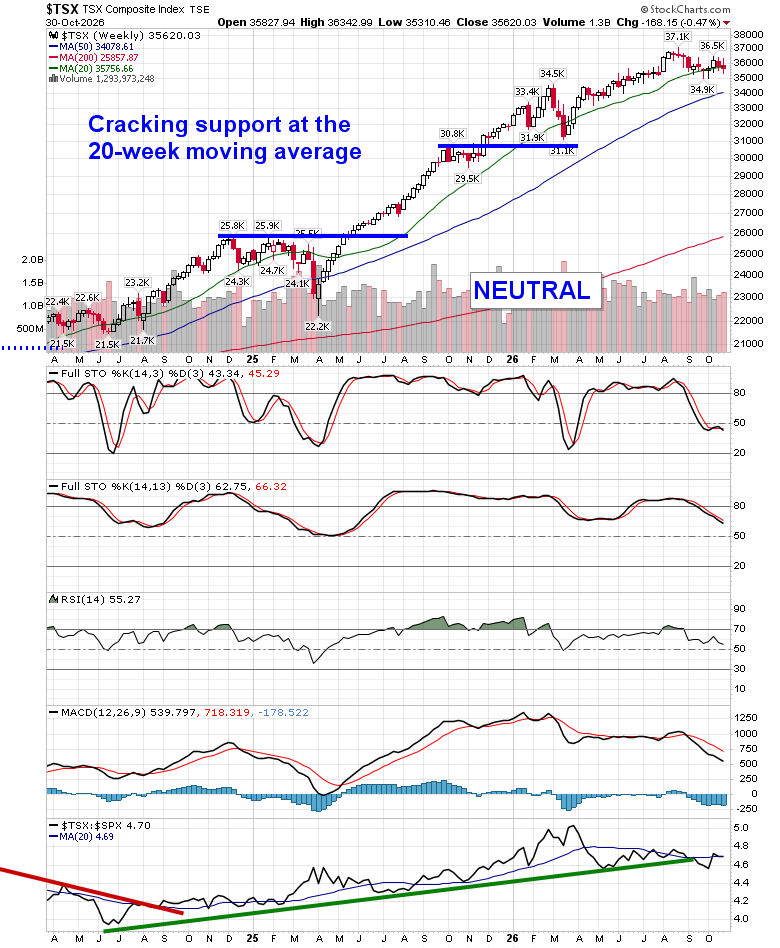
- Respecting the 20-week moving average
- Risk off tone developing
- Taking on some insurance
- Consumer stocks for the end of year holidays
- Strength in Transportation
- Booking profits in Software
- Rates and Dollar
- Oil
- Building a Portfolio Around Mid-Caps
- Our list of all segments of the market to either Accumulate or Avoid, along with relevant ETFs
- Positioning for the months ahead
- Sector Reviews and Ratings
- Stocks that have Frequently Gained in the Month of November
- Notable Stocks and ETFs Entering their Period of Strength in November
Subscribers can look for this 111-page report in their inbox and in the report archive. Not a subscriber? Signup here.
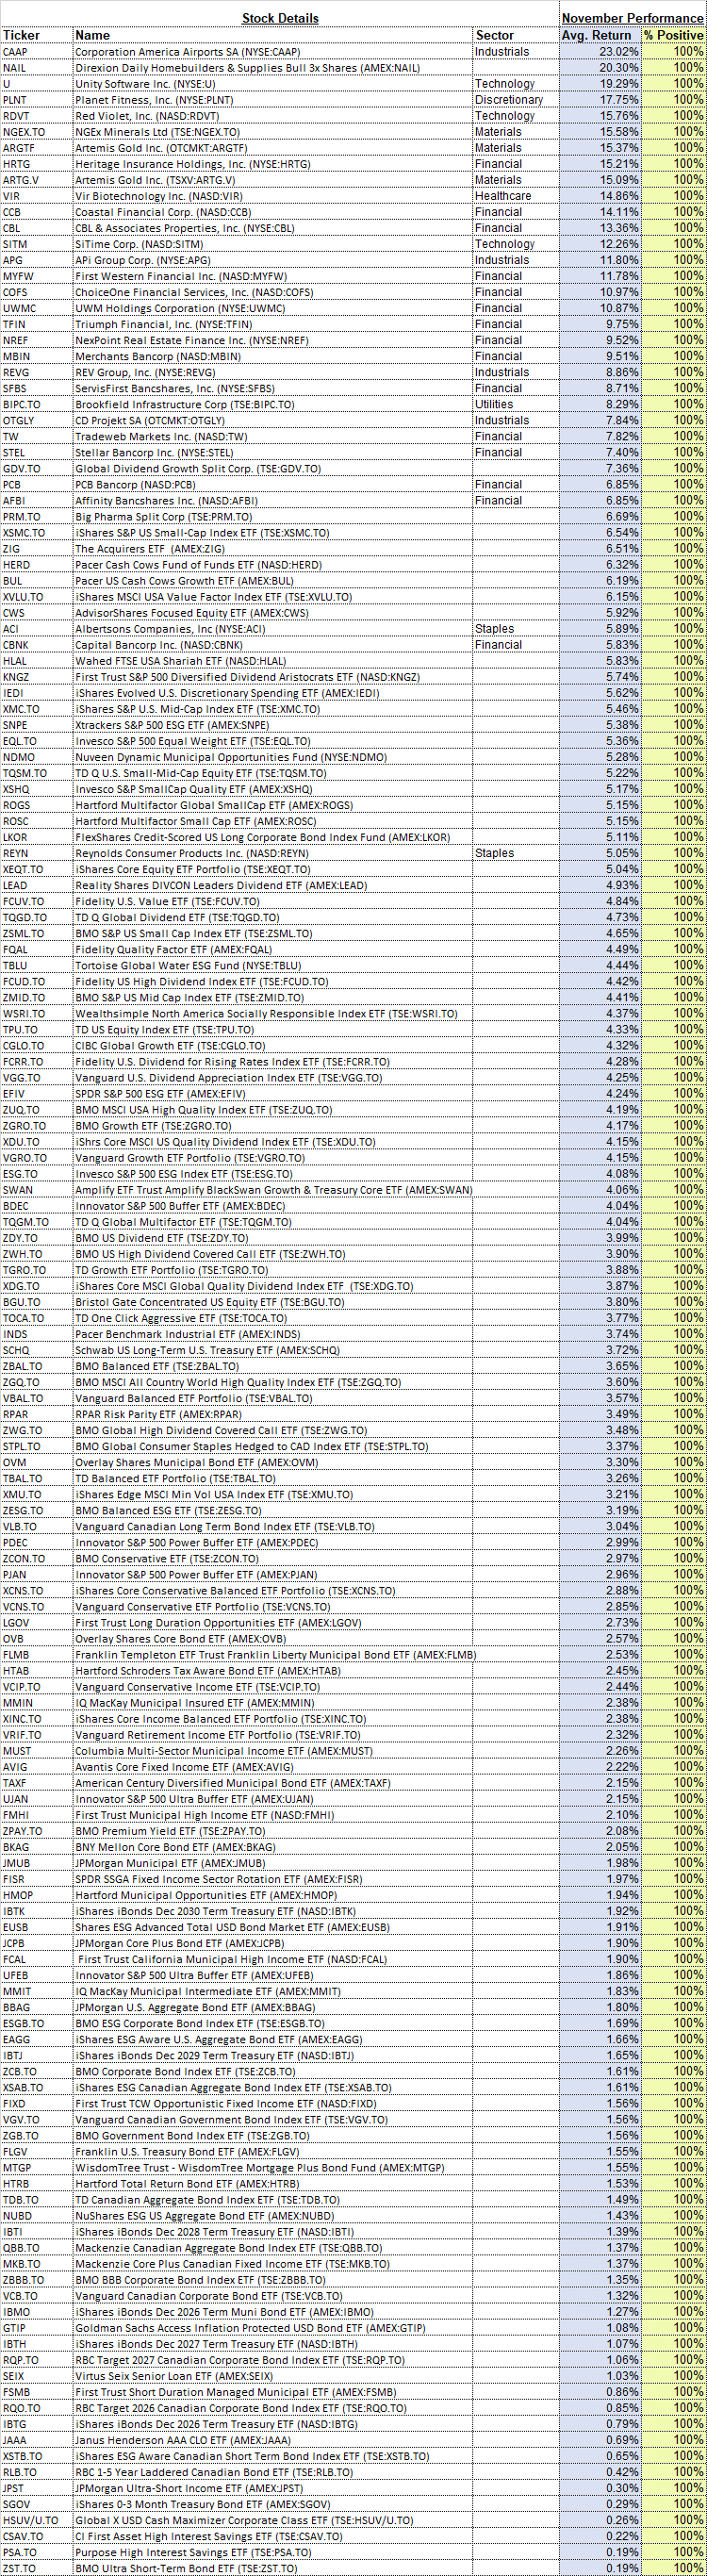
With the new month upon us and as we celebrate the release of our monthly report for November, today we release our screen of all of the stocks that have gained in every November over their trading history. While we at Equity Clock focus on a three-pronged approach (seasonal, technical, and fundamental analysis) to gain exposure to areas of the market that typically perform well over intermediate (2 to 6 months) timeframes, we know that stocks that have a 100% frequency of success for a particular month is generally of interest to those pursuing a seasonal investment strategy. Below are the results:
And how about those securities that have never gained in this second to last month of the year, here they are:
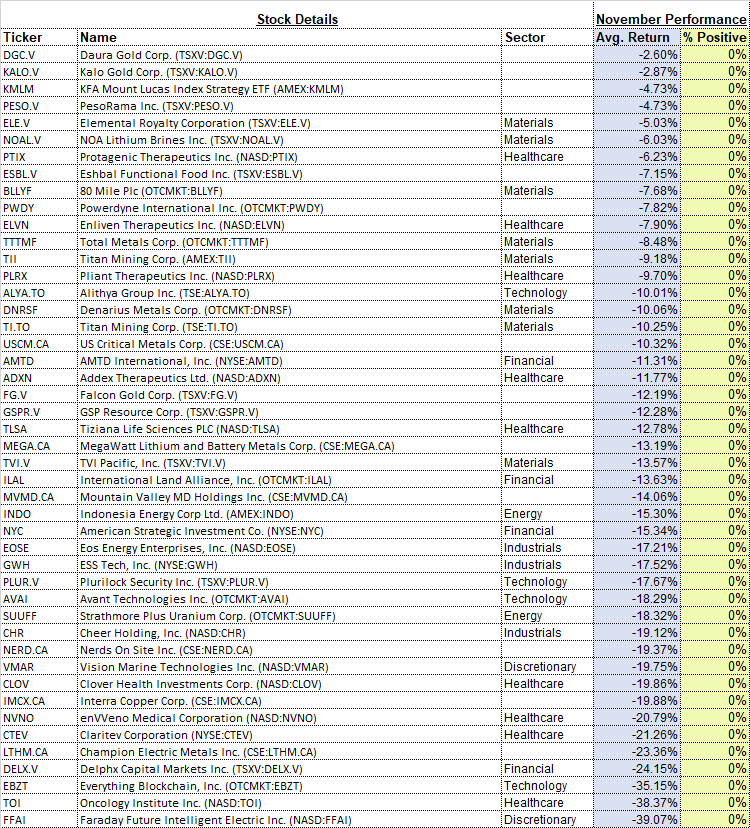
*Note: None of the results highlighted above have the 20 years of data that we like to see in order to accurately gauge the annual recurring, seasonal influences impacting an investment, therefore the reliability of the results should be questioned. We present the above list as an example of how our downloadable spreadsheet available to yearly subscribers can be filtered. For a more extensive list of high frequency (70% ) gainers for the month of November, please refer to our monthly report.
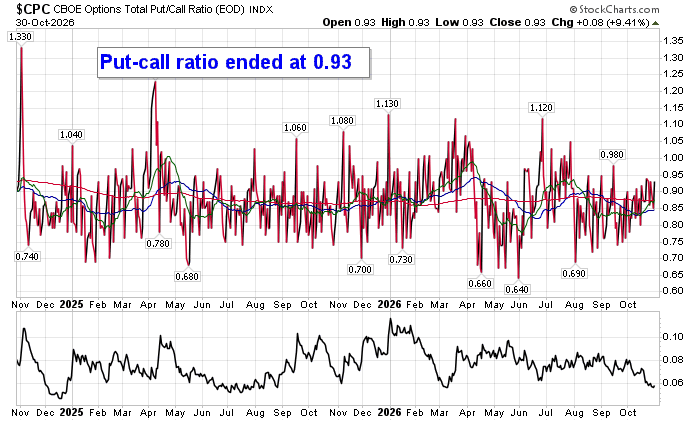
Sentiment on Friday, as gauged by the put-call ratio, ended surprisingly bullish at 0.93.
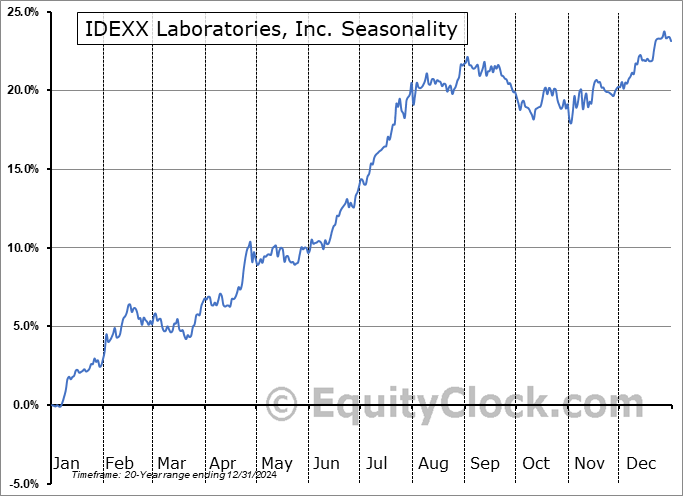
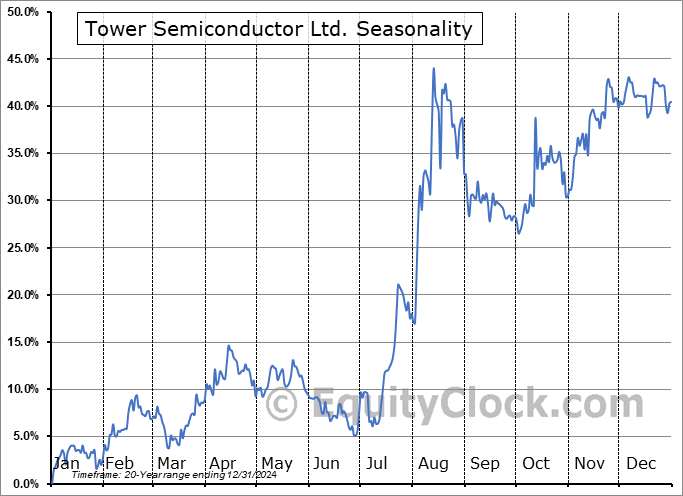
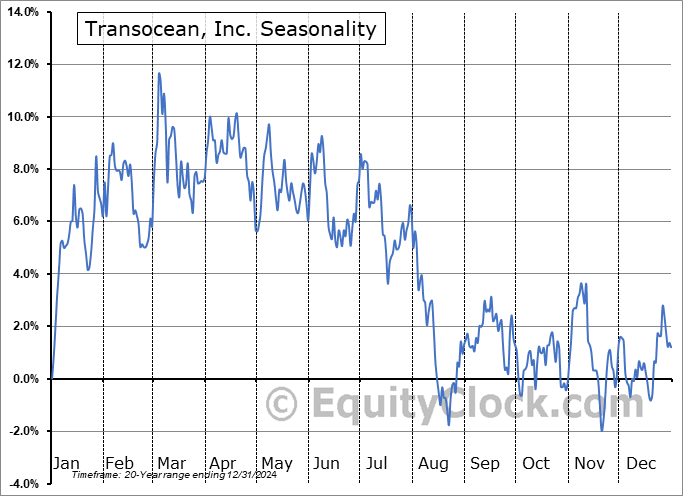
Seasonal charts of companies reporting earnings today:








S&P 500 Index
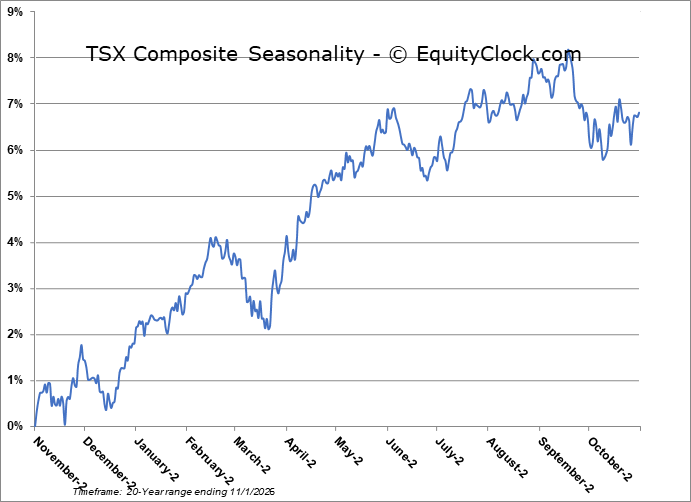
TSE Composite
| Sponsored By... |

|


