Stock Market Outlook for June 8, 2026

End of week selloff places a pin in the rally off of the March lows.
*** Stocks highlighted are for information purposes only and should not be considered as advice to purchase or to sell mentioned securities. As always, the use of technical and fundamental analysis is encouraged in order to fine tune entry and exit points to average seasonal trends.
Stocks Entering Period of Seasonal Strength Today:
Subscribers Click on the relevant link to view the full profile. Not a subscriber? Signup here.
Stock Highlight: |
|

Murphy USA Inc. (NYSE:MUSA) Seasonal Chart |
|

International General Insurance Holdings Ltd. (NASD:IGIC) Seasonal Chart

Halozyme Therapeutics Inc. (NASD:HALO) Seasonal Chart

Fidelity US High Quality Index ETF (TSE:FCUQ.TO) Seasonal Chart

Vanguard Long-Term Bond ETF (NYSE:BLV) Seasonal Chart

iShares MSCI Japan Small-Cap ETF (NYSE:SCJ) Seasonal Chart
Disclaimer: Comments and opinions offered in this report are for information only. They should not be considered as advice to purchase or to sell mentioned securities. Data offered is believed to be accurate, but is not guaranteed.
The Markets
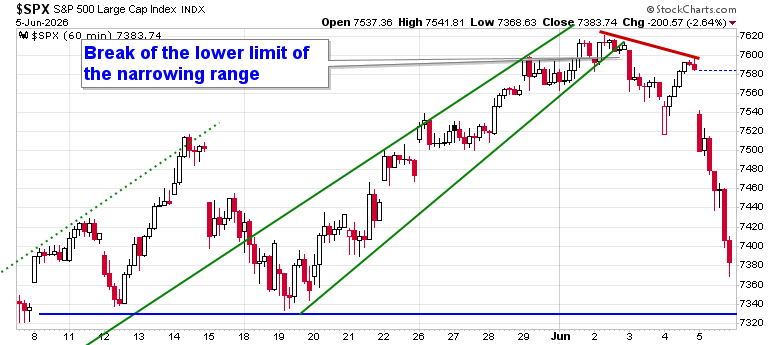
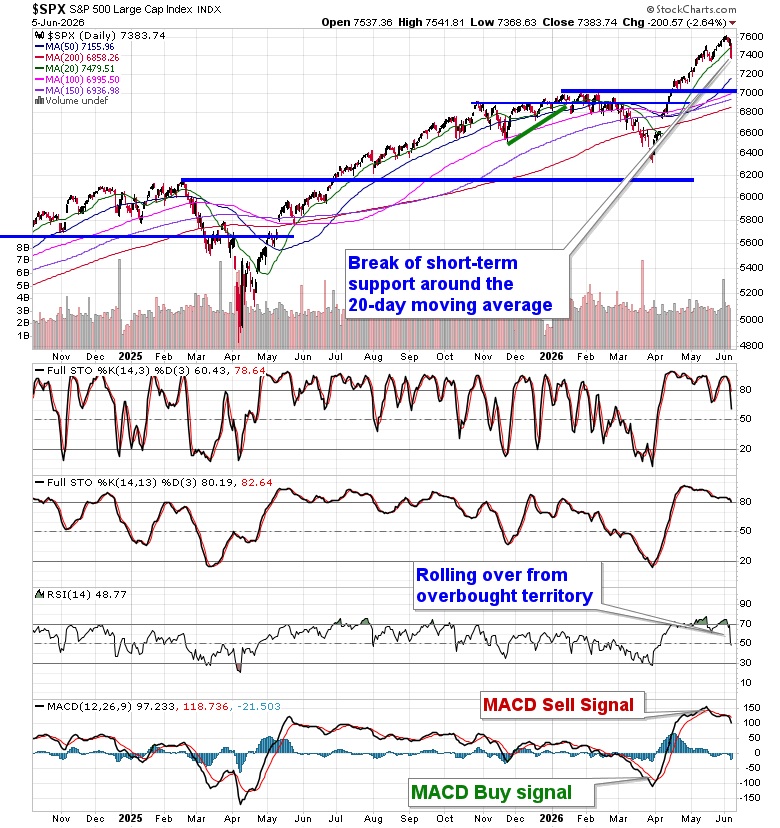
Stocks dropped sharply on Friday as ongoing rotation out of technology sector leaders took some froth out of the market heading into the weakest part of June through the weeks ahead. The S&P 500 Index plunged by 2.64%, instantly retracing most of the grind higher from the narrowing trading range from the past couple of weeks, something that we alluded to as a risk following the breakdown below the pattern in recent days. A cap has been imposed around the 7600 level and short-term support around the rising 20-day moving average (7,479) has been violated. Levels back to previously broken horizontal resistance around 7000 are fair game amidst a digestion of early year strength aligned with this weaker period on the calendar before the end of the quarter. In the Seasonal Advantage Portfolio that we manage for clients at CastleMoore, we had already prepared for a more volatile/risk-off market framework prior to Friday’s downfall. The conflict/deal in Iran is the ongoing wildcard and the cues that we have been following that warranted moving towards a more defensive posture in risk assets have not gone away (and, arguably, our thesis was reconfirmed, in a big way, in the past week). Subscribers can view the themes in our chart books to either Accumulate or Avoid that we continue to gear portfolios towards.
Today, in our Market Outlook to subscribers, we discuss the following:
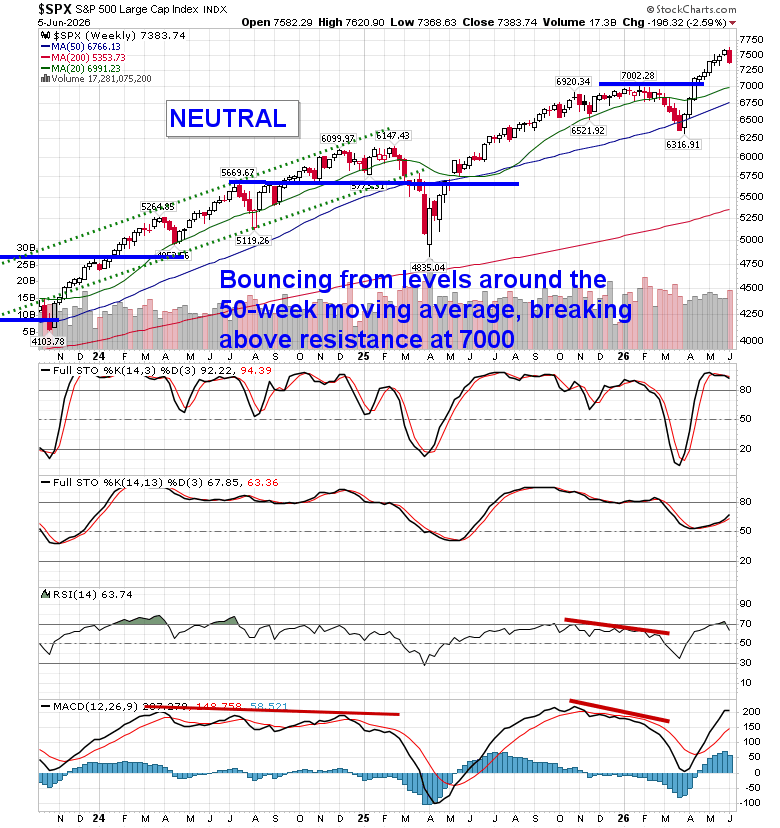
- Weekly look at the large-cap benchmark
- Rising yields and the dollar and how we are hedging the impact
- US NonFarm Payrolls and the investment implications within
- Canada Labour Force Survey and the investment implications to tailor portfolios around
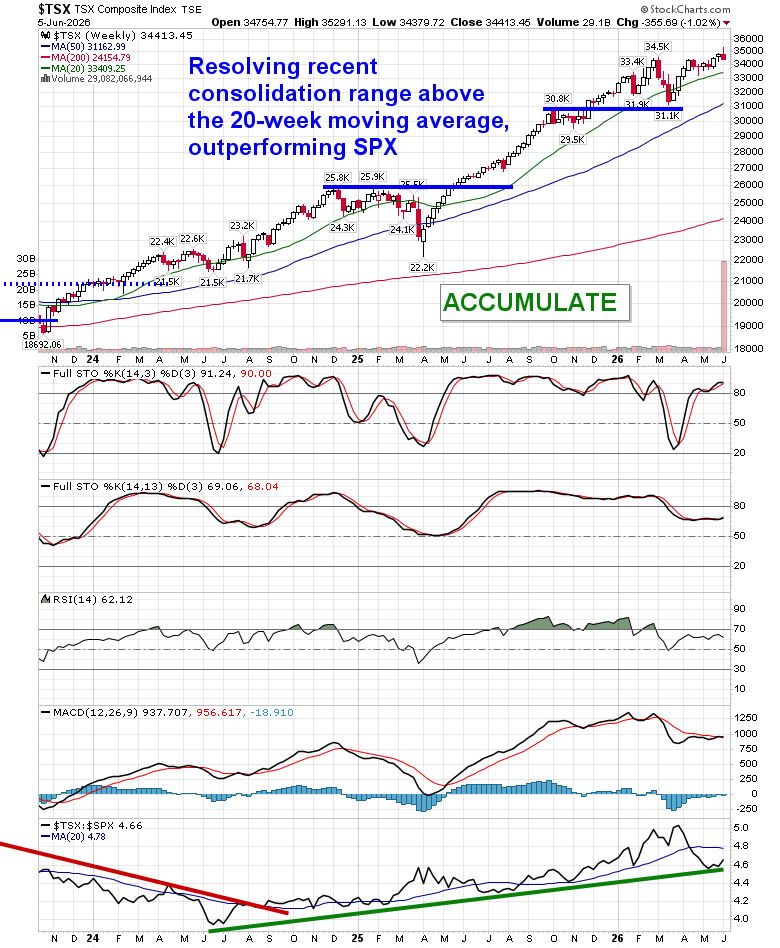
- Canadian over US stocks
Subscribers can look for this report in their inbox or by clicking on the following link and logging in: Market Outlook for June 8
Not signed up yet? Subscribe now to receive full access to all of the research and analysis that we publish
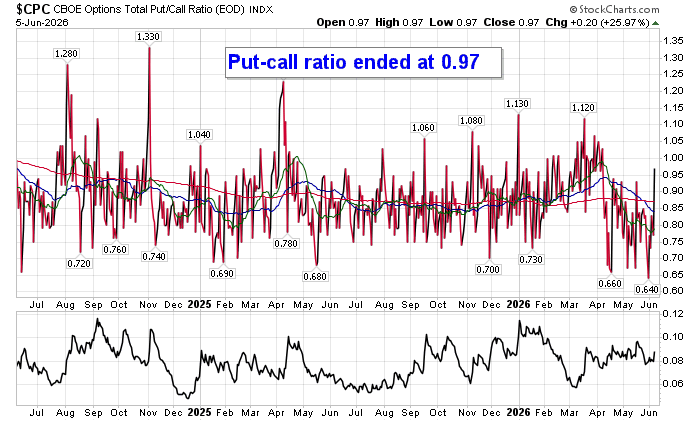
Sentiment on Friday, as gauged by the put-call ratio, ended close to neutral at 0.97.
Seasonal charts of companies reporting earnings today:


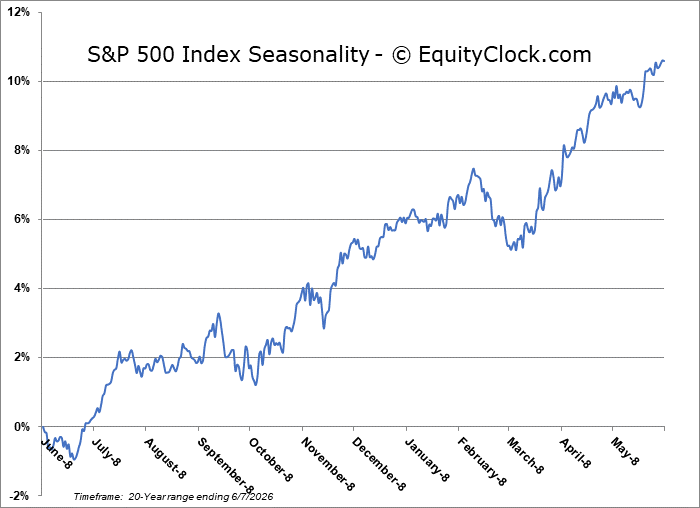
S&P 500 Index
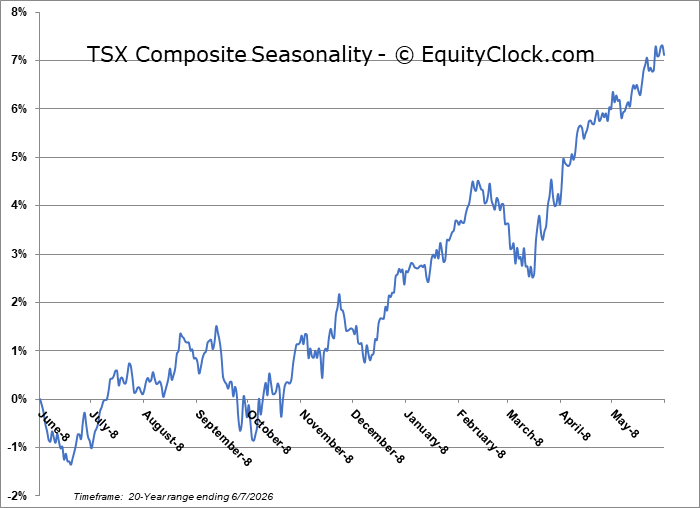
TSE Composite
| Sponsored By... |

|


