Stock Market Outlook for June 30, 2026

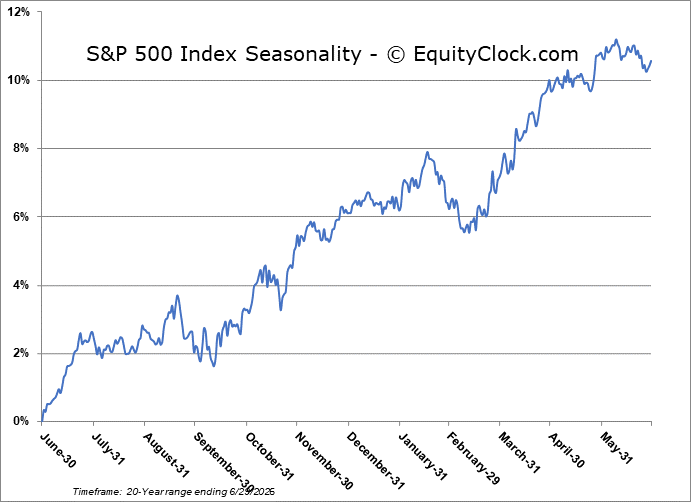
And, just like that, the Summer Rally is underway.
*** Stocks highlighted are for information purposes only and should not be considered as advice to purchase or to sell mentioned securities. As always, the use of technical and fundamental analysis is encouraged in order to fine tune entry and exit points to average seasonal trends.
Stocks Entering Period of Seasonal Strength Today:
Subscribers Click on the relevant link to view the full profile. Not a subscriber? Signup here.
Stock Highlight: |
|

abrdn Physical Palladium Shares ETF (NYSE:PALL) Seasonal Chart |
|

Regeneron Pharmaceuticals, Inc. (NASD:REGN) Seasonal Chart
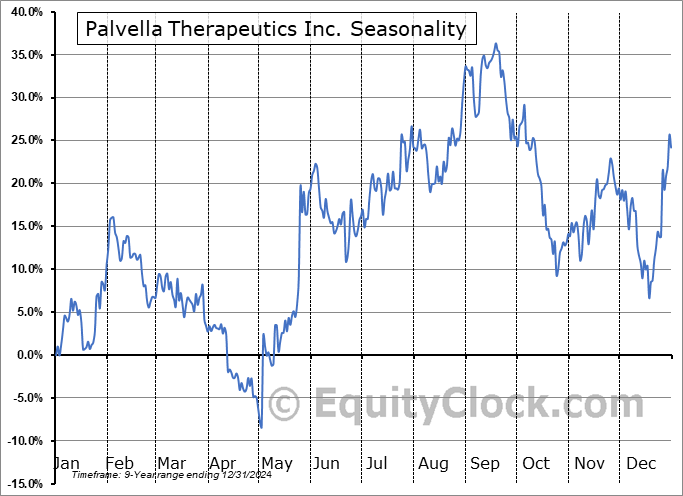
Palvella Therapeutics Inc. (NASD:PVLA) Seasonal Chart

Barrett Business Services, Inc. (NASD:BBSI) Seasonal Chart
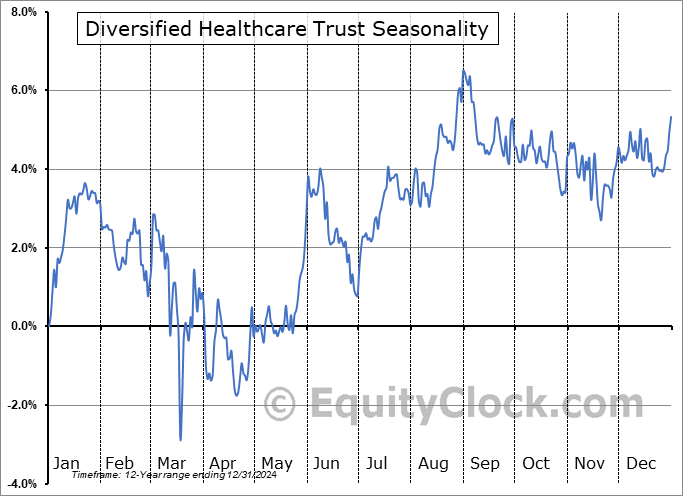
Diversified Healthcare Trust (NASD:DHCNI) Seasonal Chart

iShares MSCI UAE Capped ETF (NASD:UAE) Seasonal Chart
Disclaimer: Comments and opinions offered in this report are for information only. They should not be considered as advice to purchase or to sell mentioned securities. Data offered is believed to be accurate, but is not guaranteed.
The Markets
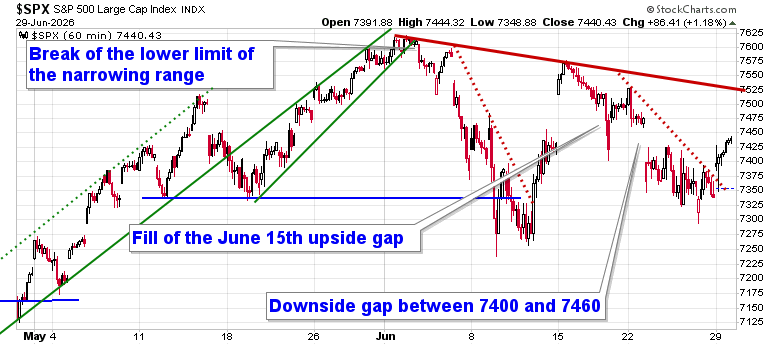
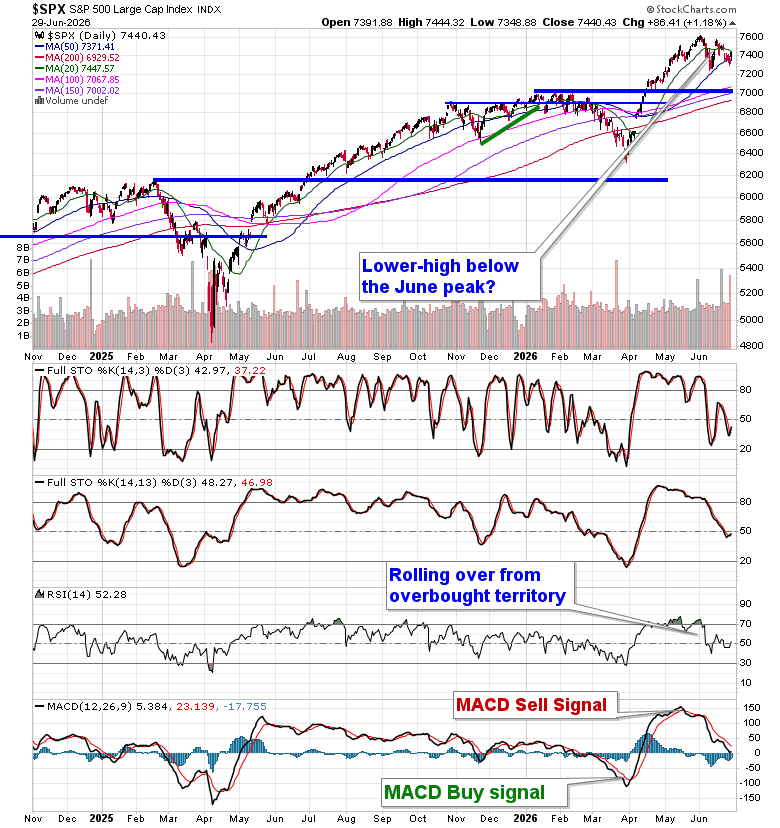
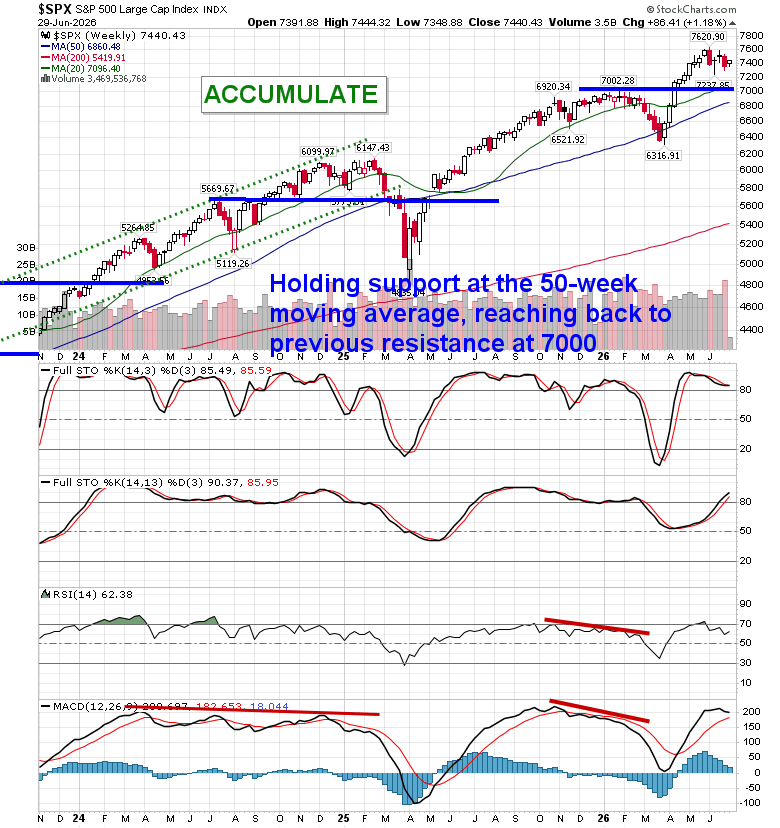
Quarter-end window dressing was conducive to a strong start to the summer rally period for stocks as investors raced towards many of the technology darlings that had been sold off in recent days/week, yet have produced impressive quarter-to-date gains. The S&P 500 Index added 1.18%, moving into the downside gap that was opened a week ago between 7400 and 7460. A break of ultra-short-term declining trendline resistance alludes to the end of the notorious mean reverting period in June and the start of the positivity that this mid-year period offers. Intermediate-term support at the 50-day moving average at 7371 continues to stand in the way of a more detrimental digestion of early year strength, coinciding with the end of quarter rebalancing period. The benchmark continues to show struggle below the June high around 7600 in a pattern that has all the hallmarks of consolidation of early year strength rather than a trend shift. Daily momentum indicators are starting to curl higher, triggering near-term buy signals that align nicely with the start of the summer rally phase. In the Seasonal Advantage Portfolio that we manage for clients at CastleMoore, we took off our volatility hedges last week and we put cash to work. Further transactions were executed on Monday to increase beta of the portfolio further to setup for this risk-on time of the year. Subscribers can view the themes in our chart books to either Accumulate or Avoid that we continue to gear portfolios towards.
Want to know which areas of the market to buy or sell? Our Weekly Chart Books have just been updated, providing a clear Accumulate, Avoid, or Neutral rating for currencies, cryptocurrencies, commodities, broad markets, and subsectors/industries of the market. Subscribers can login and click on the relevant links to access.
- Currencies
- Cryptocurrencies
- Commodities
- Major Benchmarks
- Sub-sectors / Industries
- ETFs: Bonds | Commodities | Equity Markets | Industries | Sectors
Today, in our Market Outlook to subscribers, we discuss the following:
- Our weekly chart books update and our list of all segments of the market to Accumulate or Avoid
- The start of the summer rally period
- Other Notes
Subscribers can look for this report in their inbox or by clicking on the following link and logging in: Market Outlook for June 30
Not signed up yet? Subscribe now to receive full access to all of the research and analysis that we publish
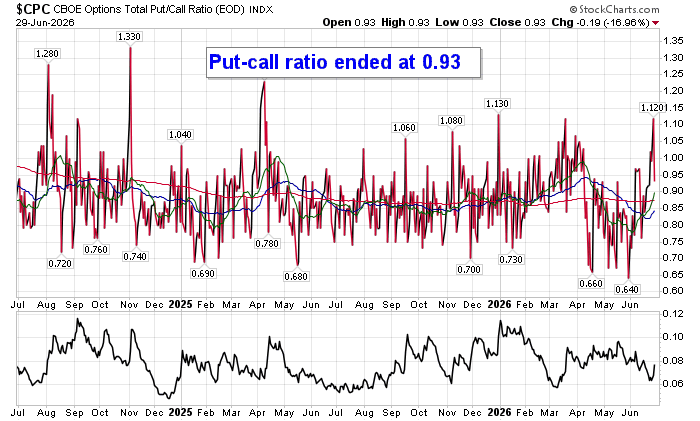
Sentiment on Monday, as gauged by the put-call ratio, ended bullish at 0.93.
Seasonal charts of companies reporting earnings today:


S&P 500 Index
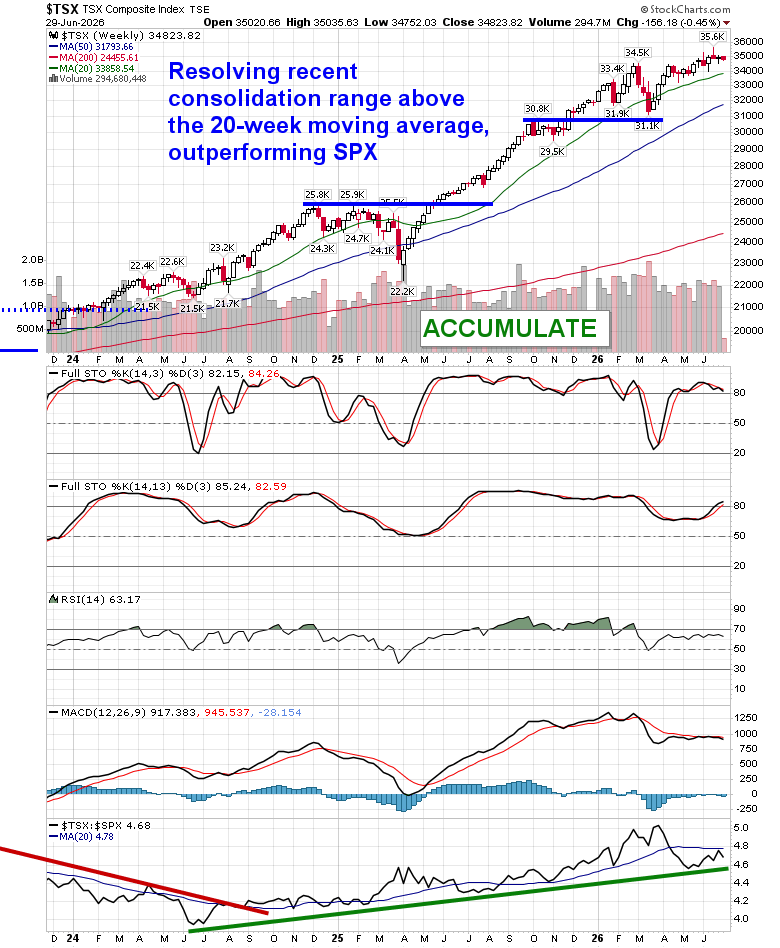
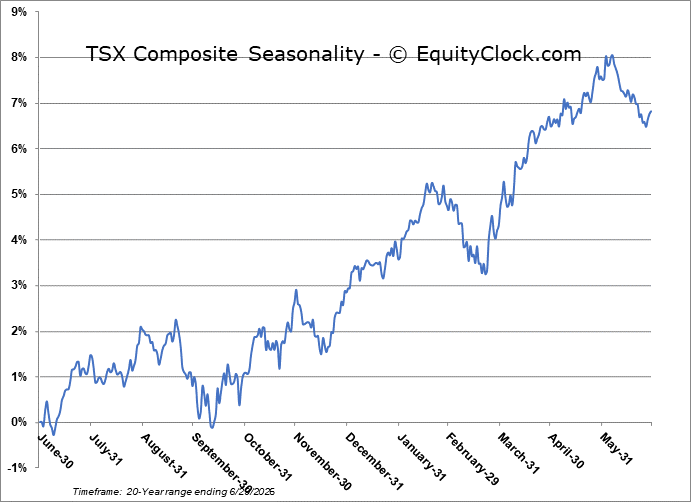
TSE Composite
| Sponsored By... |

|


