Stock Market Outlook for July 6, 2026

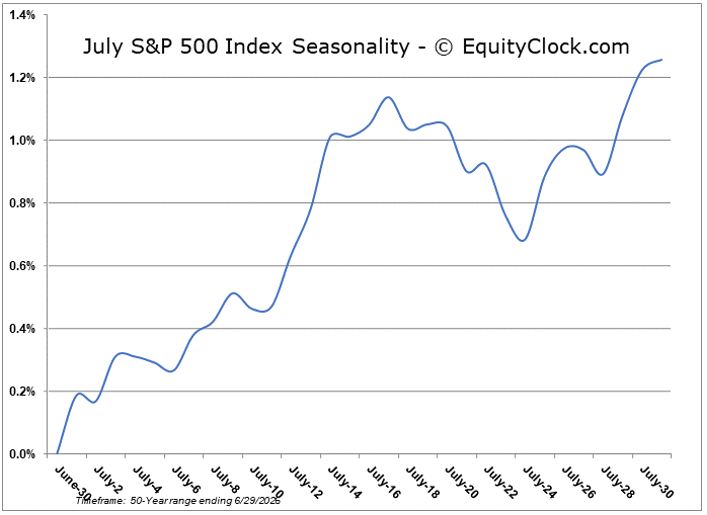
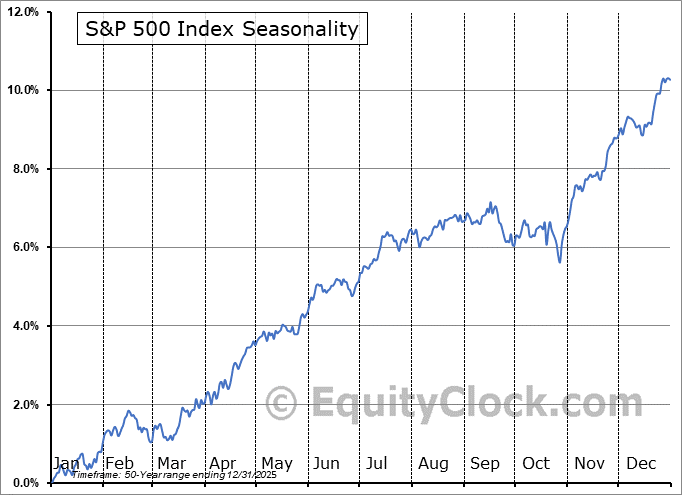
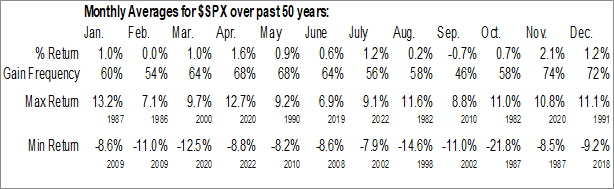
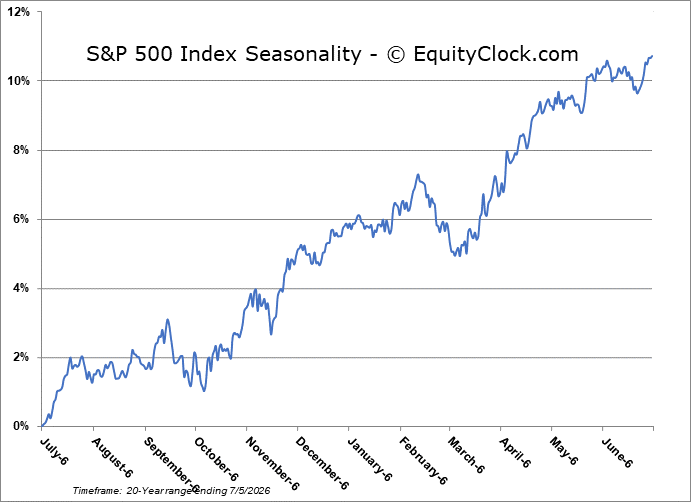
The S&P 500 Index has managed to gain an average of 1.2%, overall, in July. However, only 56% of periods over the past 50 years have produced gains.
*** Stocks highlighted are for information purposes only and should not be considered as advice to purchase or to sell mentioned securities. As always, the use of technical and fundamental analysis is encouraged in order to fine tune entry and exit points to average seasonal trends.
Stocks Entering Period of Seasonal Strength Today:
Subscribers Click on the relevant link to view the full profile. Not a subscriber? Signup here.
Stock Highlight: |
|

Consolidated Edison, Inc. (NYSE:ED) Seasonal Chart |
|

iShares Core S&P 500 Index ETF (CAD- Hedged) (TSE:XSP.TO) Seasonal Chart
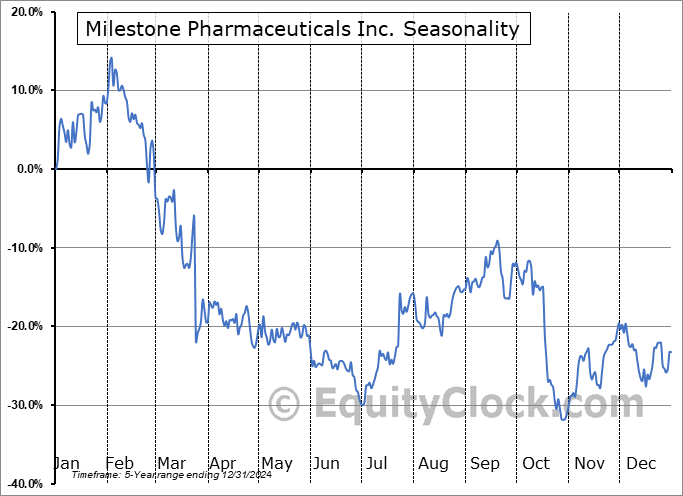
Milestone Pharmaceuticals Inc. (NASD:MIST) Seasonal Chart

Richelieu Hardware Ltd. (TSE:RCH.TO) Seasonal Chart

Coeur Mining Inc (NYSE:CDE) Seasonal Chart

Vanguard Balanced ETF Portfolio (TSE:VBAL.TO) Seasonal Chart

Radian Group, Inc. (NYSE:RDN) Seasonal Chart

iShares Convertible Bond ETF (AMEX:ICVT) Seasonal Chart

Ameren Corp. (NYSE:AEE) Seasonal Chart

Bank Of Montreal (NYSE:BMO) Seasonal Chart

SPDR MSCI ACWI IMI ETF (AMEX:SPGM) Seasonal Chart

Invesco S&P SmallCap 600 Pure Value ETF (NYSE:RZV) Seasonal Chart

Elbit Systems Ltd. (NASD:ESLT) Seasonal Chart
Disclaimer: Comments and opinions offered in this report are for information only. They should not be considered as advice to purchase or to sell mentioned securities. Data offered is believed to be accurate, but is not guaranteed.
Note: The holiday shortened week brings plenty of disruptions in market trading over the next few days with the Canadian Market closed on July 1st (for Canada Day) and the US Markets closed on July 3rd (for Independence Day). As a result, we will return with our regular reporting on Monday, July 6th. We will update the seasonal charts for the various economic data over the next few days, including the US Employment Situation report on Thursday, and provide any relevant updates through our social media platforms (StockTwits, X, Reddit) @EquityClock. Enjoy the long weekend!
The Markets
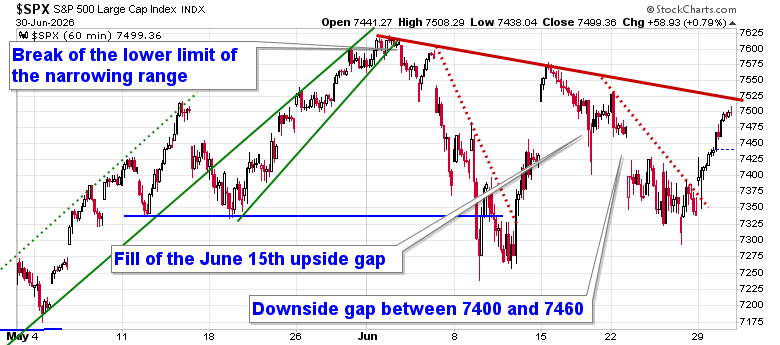
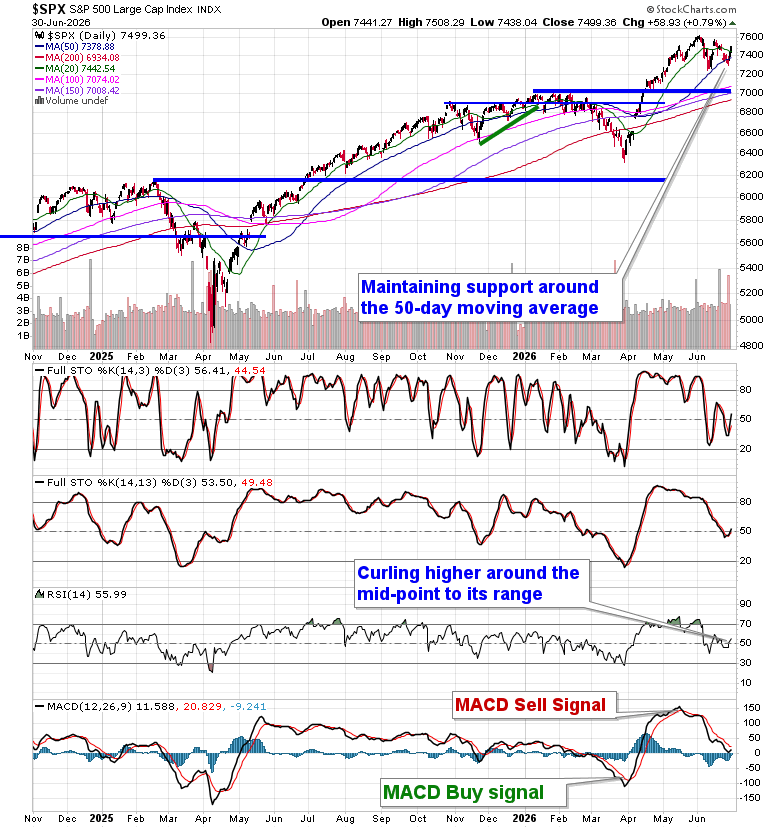
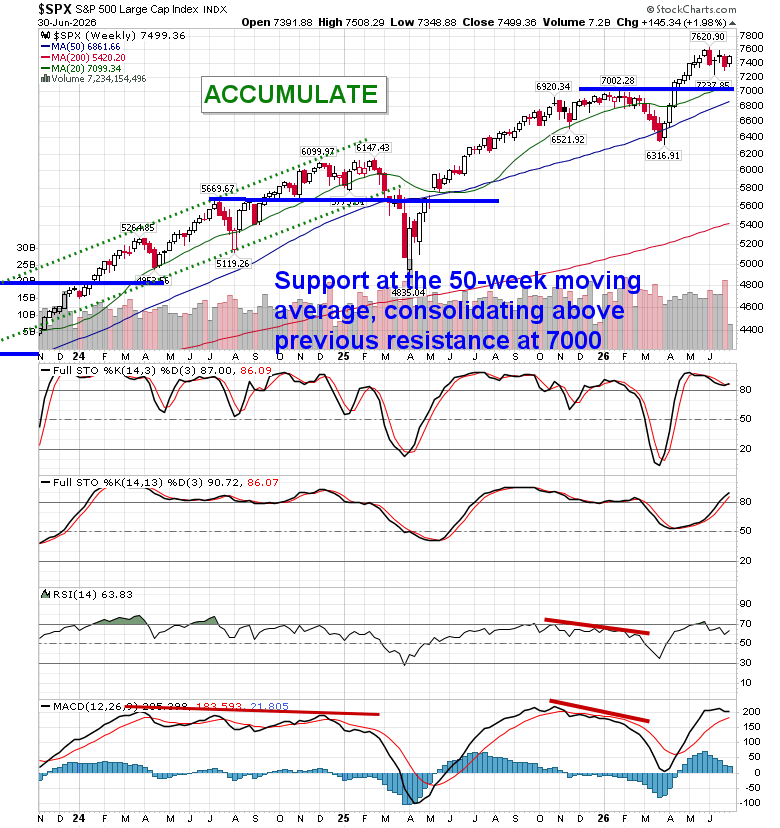
Another day of quarter-end window dressing is quickly achieving the gains that are normal for the summer rally period in the market between the end of June and the first few weeks of July. The S&P 500 Index added around eight-tenths of one percent, closing the downside gap that was opened a week ago between 7400 and 7460. Declining trendline resistance that had capped the market momentum through the month of June is presently being tested as resistance around 7500. A break of ultra-short-term declining trendline resistance at the start of the week alludes to the end of the notorious mean reverting period in June and the start of the positivity that this mid-year period offers. The benchmark has shown struggle below the June high around 7600 in a pattern that has all the hallmarks of consolidation of early year strength rather than a trend shift, suggesting the fuel is present to see a test/breakout through this mid-year period of strength that is upon us. Daily momentum indicators have curled higher, triggering near-term buy signals that align nicely with the start of the summer rally phase; MACD is encroaching on its signal line in what should amount to a fresh buy signal following the sell trigger that was recorded in the middle of May. In the Seasonal Advantage Portfolio that we manage for clients at CastleMoore, we took off our volatility hedges last week and we put cash to work. Further transactions were executed on Monday to increase beta of the portfolio further to setup for this risk-on time of the year. Subscribers can view the themes in our chart books to either Accumulate or Avoid that we continue to gear portfolios towards.
As for the equity market tendency for the month of July, overall, the month tends to warrant a positive bias, at least for the first half. Of course, we have highlighted the summer rally period that spans the first few weeks of the month. While the back half of the month is not as favourable, the S&P 500 Index has managed to gain an average of 1.2%, overall, for the first month of the third quarter. However, only 56% of periods over the past 50 years have produced gains. Returns have ranged from a loss of 7.9% in July of 2002 to a gain of 9.1% in July of 2022. As already alluded to, the front half of the month tends to be the period to benefit from positive equity market returns. The last two weeks of the month have been essentially flat, higher by a mere 0.11%, on average. Anticipation surrounding earnings helps to provide the early month lift, but once the results have been disseminated and digested, investors become inclined to book profits before running off on their summer vacations.
Just Released…
Our monthly report for July is out, providing you with everything that you need to know to navigate the market through the month(s) ahead.
Highlights in this report include:
- Equity market tendencies in the month of July
- Trading the period of seasonal volatility ahead
- Gold
- The Summer Rally
- Scrutiny warranted of the cost of borrowing and the appreciation of the US Dollar
- Crypto winter continues
- Growth Over Value
- Not all “Growth” sectors growing
- It is not just energy prices fueling inflationary pressures in the economy
- PEG Ratio suggesting the market is undervalued
- Credit conditions providing the green light for stocks ahead
- Canadian Banks
- Opportunities outside of the US
- Looking to defend against third quarter equity market volatility with Defense
- Biotech resolving its consolidation pattern
- Hot Manufacturing Economy Demands a lot of Materials
- Desired sectors for the Summer Rally Period in July
- Our list of all segments of the market to either Accumulate or Avoid, along with relevant ETFs
- Positioning for the months ahead
- Sector Reviews and Ratings
- Stocks that have Frequently Gained in the Month of July
- Notable Stocks and ETFs Entering their Period of Strength in July
Subscribers can look for this 109-page report in their inbox and in the report archive.
Not signed up yet? Subscribe now to receive full access to all of the research and analysis that we publish
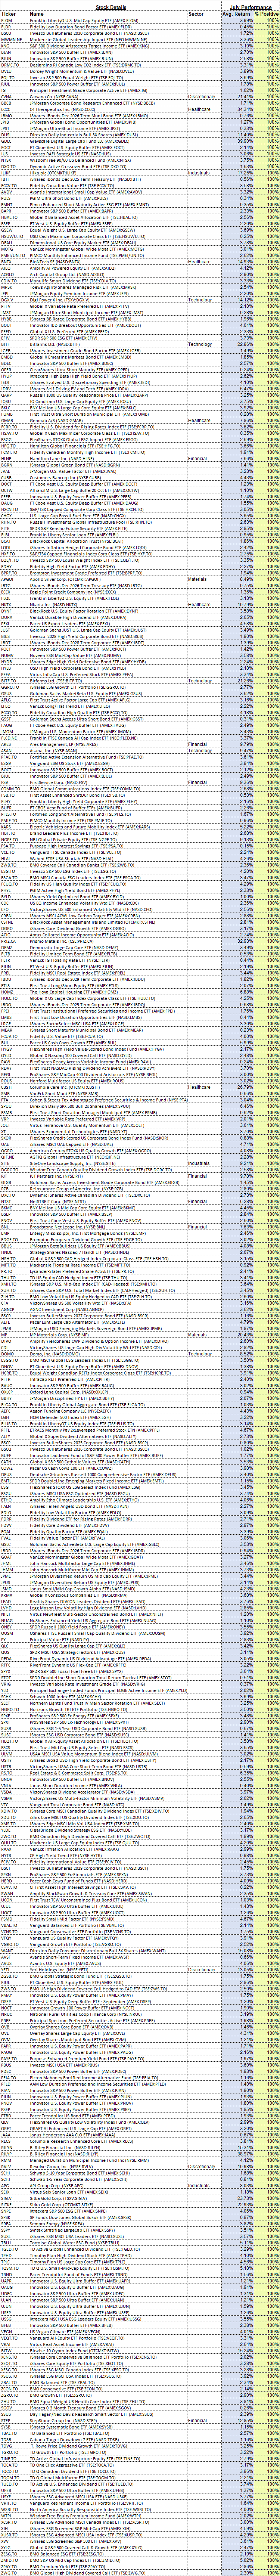
With the new month upon us and as we celebrate the release of our monthly report for July, today we release our screen of all of the stocks that have gained in every July over their trading history. While we at Equity Clock focus on a three-pronged approach (seasonal, technical, and fundamental analysis) to gain exposure to areas of the market that typically perform well over intermediate (2 to 6 months) timeframes, we know that stocks that have a 100% frequency of success for a particular month is generally of interest to those pursuing a seasonal investment strategy. Below are the results:
And how about those securities that have never gained in this seventh month of the year, here they are:
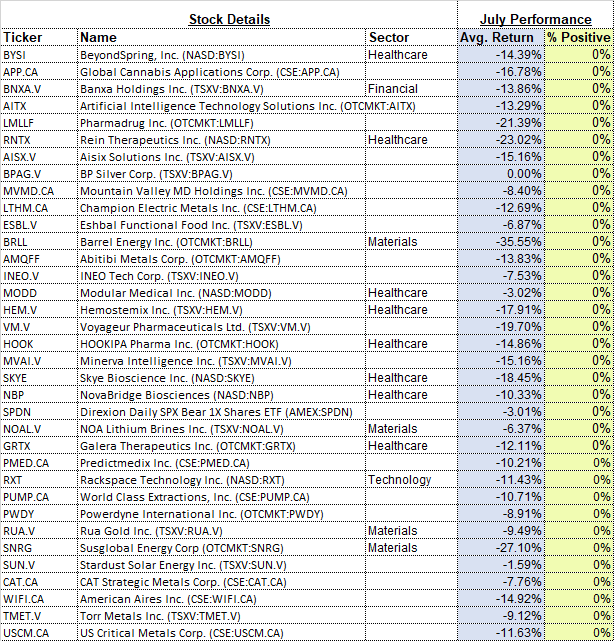
*Note: None of the results highlighted above have the 20 years of data that we like to see in order to accurately gauge the annual recurring, seasonal influences impacting an investment, therefore the reliability of the results should be questioned. We present the above list as an example of how our downloadable spreadsheet available to yearly subscribers can be filtered. For a more extensive list of high frequency (70% ) gainers for the month of July, please refer to our monthly report.
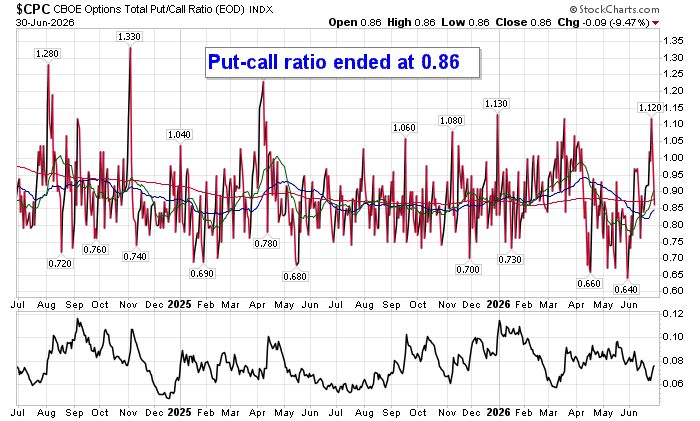
Sentiment on Tuesday, as gauged by the put-call ratio, ended bullish at 0.86.
Seasonal charts of companies reporting earnings today:


S&P 500 Index
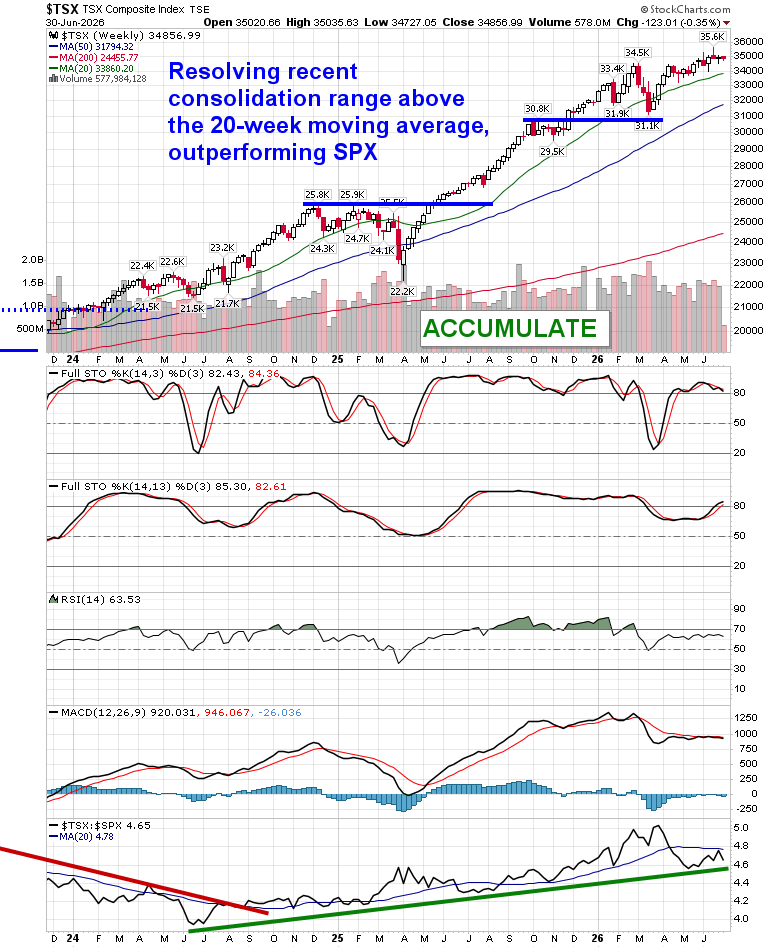
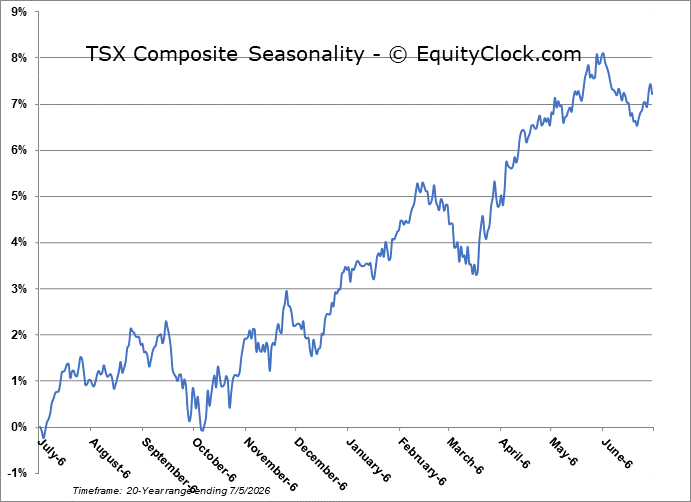
TSE Composite
| Sponsored By... |

|


