Stock Market Outlook for March 31, 2026

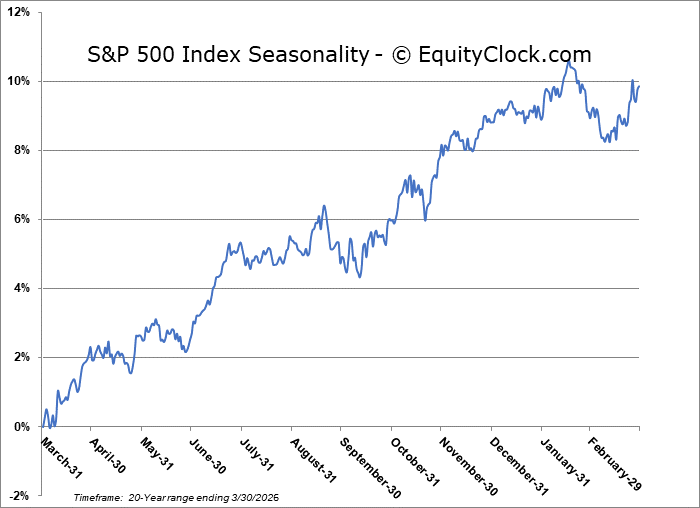
The seasonally strong month of April in the equity market will be pivotal for the longer-term trend of stocks and the economy.
*** Stocks highlighted are for information purposes only and should not be considered as advice to purchase or to sell mentioned securities. As always, the use of technical and fundamental analysis is encouraged in order to fine tune entry and exit points to average seasonal trends.
Stocks Entering Period of Seasonal Strength Today:
Subscribers Click on the relevant link to view the full profile. Not a subscriber? Signup here.
Stock Highlight: |
|
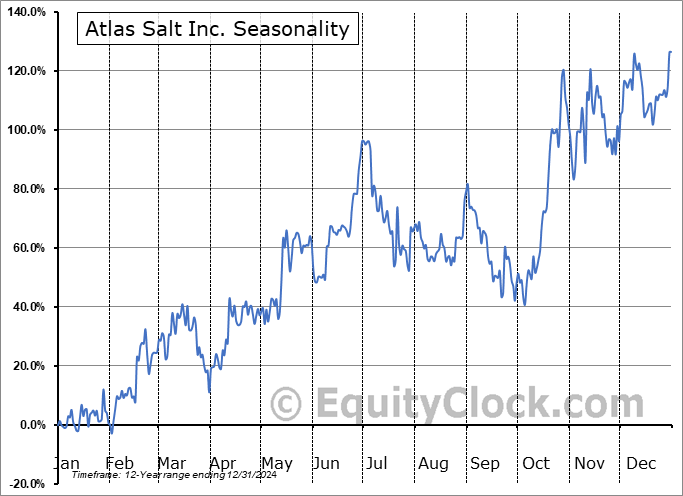
Atlas Salt Inc. (TSXV:SALT.V) Seasonal Chart |
|

Alpha Metallurgical Resources, Inc. (NYSE:AMR) Seasonal Chart
Disclaimer: Comments and opinions offered in this report are for information only. They should not be considered as advice to purchase or to sell mentioned securities. Data offered is believed to be accurate, but is not guaranteed.
The Markets
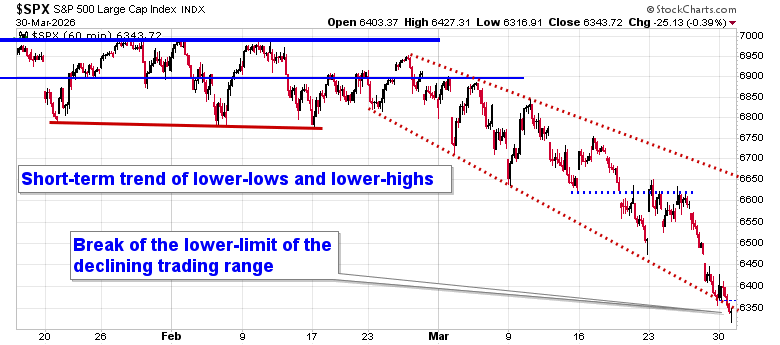
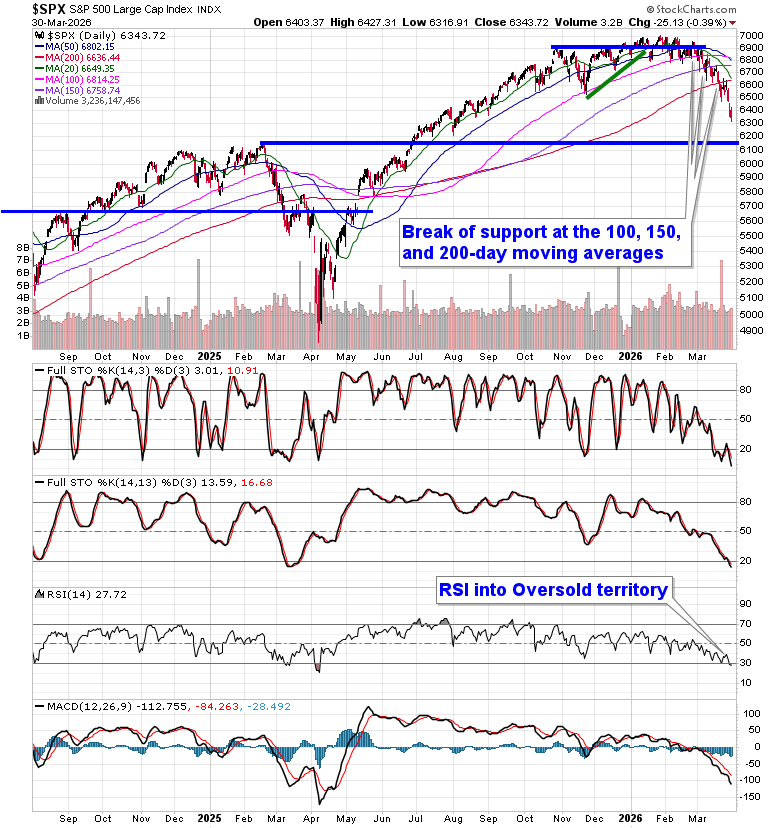
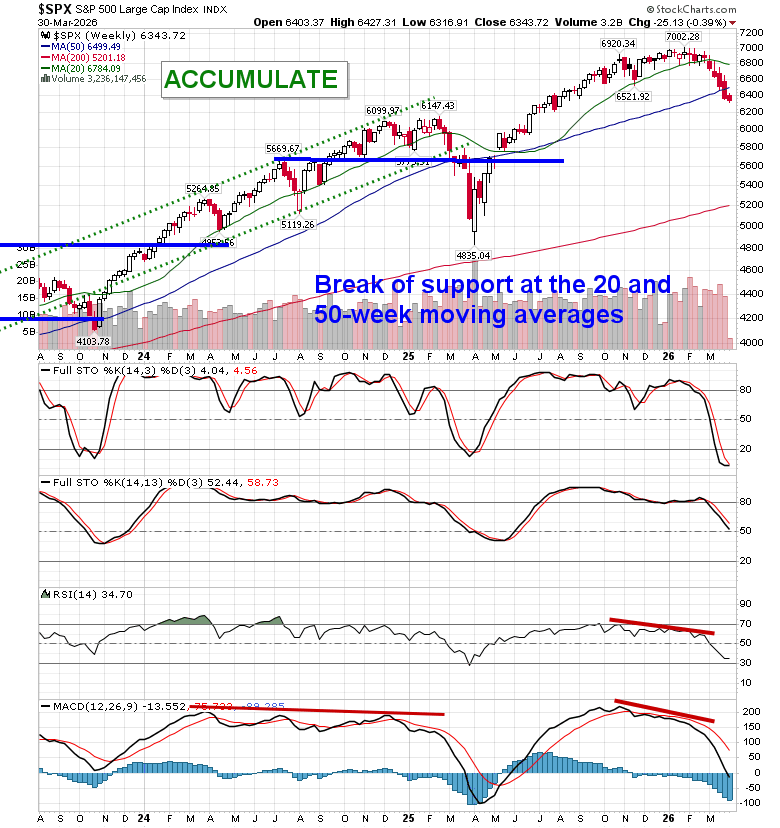
Stocks failed to maintain early session gains on Monday, drifting into the red by the closing bell. The S&P 500 Index closed down by just less than four-tenths of one, moving, again, below the lower limit of the declining trend channel that has been playing out over the past month. The decline has become parabolic, highlighting the indiscriminate de-risking that traders are enacting given the uncertainty that surrounds the conflict in Iran. The benchmark is below all major daily moving averages, unable to derive any type of support, and is relying heavily on headlines that remain unpredictable. The benchmark is back into oversold territory with the Relative Strength Index (RSI) below 30, typically a state that coincides with selling exhaustion, albeit within bear market trends. The benchmark is rapidly gravitating towards previous horizontal resistance from early in 2025 at 6100, a hurdle that is now around 200 points away (as of Monday’s lows). As highlighted on Thursday, while the short-term technicals present renewed concern and the longer-term technical profile of the market has become threatening, we still have a focus on the near-term positivity in equity markets heading into the seasonally strong period during the month of April. In the Seasonal Advantage Portfolio that we manage for clients at CastleMoore, we rotated away from our low volatility posture and added to risk exposure a week ago for the seasonally strong window that runs through the next three to five weeks. The conflict in Iran remains a wildcard and we are running down our cues that would warrant a more defensive posture in risk assets, but the net of all developments following the action from the past three days between technicals, fundamentals, and seasonals for the near-term continue to provide the edge to an upside bias. Various investment houses are attesting to the same suggesting a near-term skew based on the risk of the next social media post from the president unleashing a short-covering wave that would be inappropriate to get negative in front of. Subscribers can view the themes in our chart books to either Accumulate or Avoid that we continue to gear portfolios towards.
Want to know which areas of the market to buy or sell? Our Weekly Chart Books have just been updated, providing a clear Accumulate, Avoid, or Neutral rating for currencies, cryptocurrencies, commodities, broad markets, and subsectors/industries of the market. Subscribers can login and click on the relevant links to access.
- Currencies
- Cryptocurrencies
- Commodities
- Major Benchmarks
- Sub-sectors / Industries
- ETFs: Bonds | Commodities | Equity Markets | Industries | Sectors
Subscribe now.
Today, in our Market Outlook to subscribers, we discuss the following:
- Market Condition: Weak, Oversold, and Headline-Driven
- Oversold Setup: Bounce Risk Rising
- Positioning
- Seasonal vs Reality: April Is Pivotal
- Macro Watch: Rates & Dollar Are Critical
- New Accumulate candidate and the stocks to play
- Strategic Outlook
Subscribers can look for this report in their inbox or by clicking on the following link and logging in: Market Outlook for March 31
Not signed up yet? Subscribe now to receive full access to all of the research and analysis that we publish
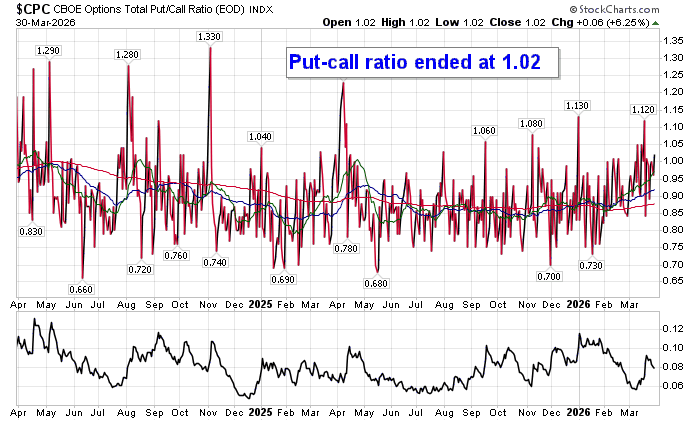
Sentiment on Monday, as gauged by the put-call ratio, ended bearish at 1.02.
Seasonal charts of companies reporting earnings today:


S&P 500 Index
TSE Composite
| Sponsored By... |

|


