Stock Market Outlook for April 27, 2026

A key gauge of investor risk sentiment is presenting caution, akin to what it revealed back in February (prior to March’s market weakness).
*** Stocks highlighted are for information purposes only and should not be considered as advice to purchase or to sell mentioned securities. As always, the use of technical and fundamental analysis is encouraged in order to fine tune entry and exit points to average seasonal trends.
Stocks Entering Period of Seasonal Strength Today:
Subscribers Click on the relevant link to view the full profile. Not a subscriber? Signup here.
Stock Highlight: |
|

New Flyer Industries Inc. (TSE:NFI.TO) Seasonal Chart |
|

Alexanders, Inc. (NYSE:ALX) Seasonal Chart

Creative Realities, Inc. (NASD:CREX) Seasonal Chart

Adentra Inc. (TSE:ADEN.TO) Seasonal Chart

RBB Bancorp (NASD:RBB) Seasonal Chart

Equitable Group Inc. (TSE:EQB.TO) Seasonal Chart

Lumen Technologies Inc (NYSE:LUMN) Seasonal Chart
Disclaimer: Comments and opinions offered in this report are for information only. They should not be considered as advice to purchase or to sell mentioned securities. Data offered is believed to be accurate, but is not guaranteed.
The Markets
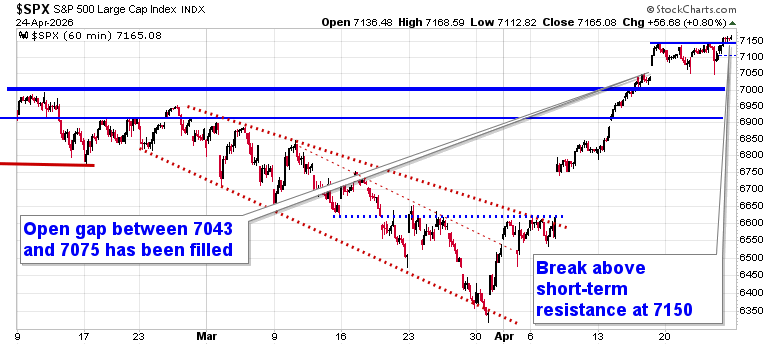
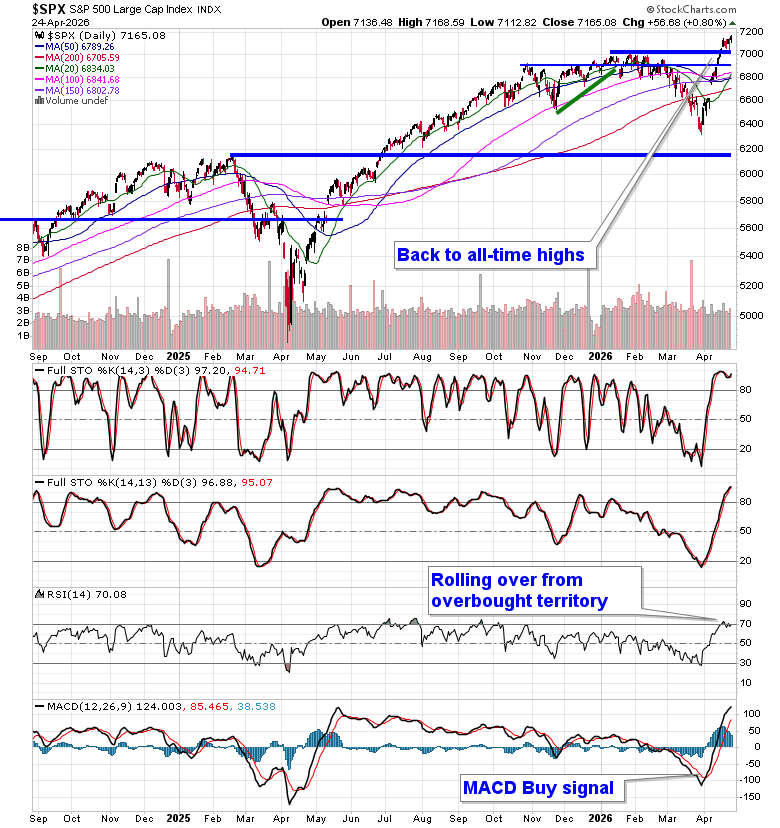
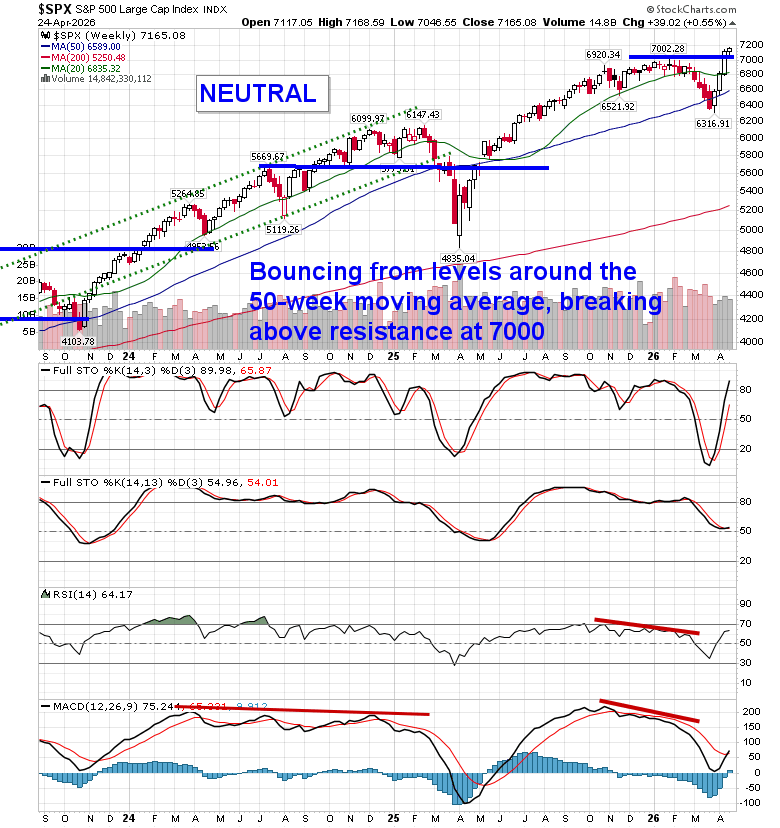
A rally in the Technology sector, fuelled by strength in the semiconductor stocks, pushed equity benchmarks in the US further into record high territory. The S&P 500 Index ended higher by eight-tenths of one percent, piercing above the short-term cap around 7150 that was highlighted as a point of resistance in our last report. A number of gaps remain unfilled below, including the big one between 6620 and 6740, but, ultimately, the character of the market has changed where levels of resistance hold less weight than levels of support (and this was proven again by the violation of resistance on Friday). Downside risks in the near-term can be pegged towards levels around 6900, but, we are still playing with a positive side bias (albeit with some hedges that have been added in recent days – see our April 22 Market Outlook). Momentum indicators have been rolling over from overbought territory, highlighting upside exhaustion and lending themselves to the prospect of a digestive phase on the horizon, particularly once we get beyond the height to earnings season next week. In the Seasonal Advantage Portfolio (which is strongly higher YTD, continuing to set new high watermarks) that we manage for clients at CastleMoore, we continue to be fully exposed to risk (stocks) after flipping from our low volatility stance around the end of March and our performance is benefitting. The conflict in Iran remains a wildcard and we are running down our cues that would warrant a more defensive posture in risk assets. Subscribers can view the themes in our chart books to either Accumulate or Avoid that we continue to gear portfolios towards.
Today, in our Market Outlook to subscribers, we discuss the following:
- Market Trend: Breakout Continues, But Momentum Is Fading
- Rally Leadership: Semiconductors Driving Gains
- Rotation: Growth Reasserting Leadership Over Value
- Short-Covering Tailwind Is Fading
- Seasonal Risk Ahead
- Consumer Strain
- Key Risk-Off Signal Emerging
- Portfolio Positioning: Stay Long, But More Tactical
Subscribers can look for this report in their inbox or by clicking on the following link and logging in: Market Outlook for April 27
Not signed up yet? Subscribe now to receive full access to all of the research and analysis that we publish
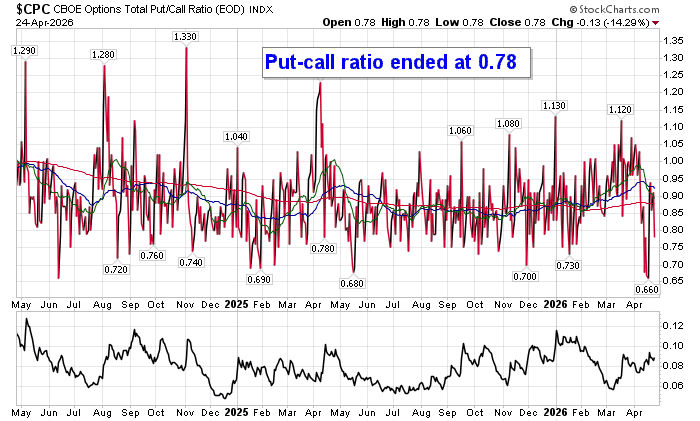
Sentiment on Friday, as gauged by the put-call ratio, ended bullish at 0.78.
Seasonal charts of companies reporting earnings today:


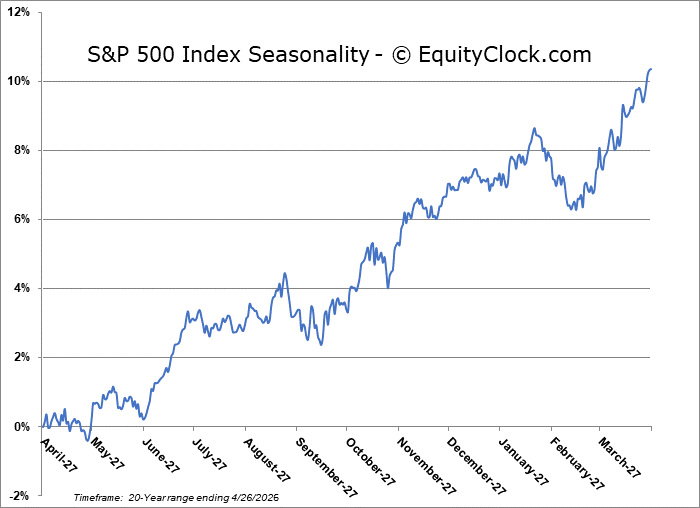
S&P 500 Index
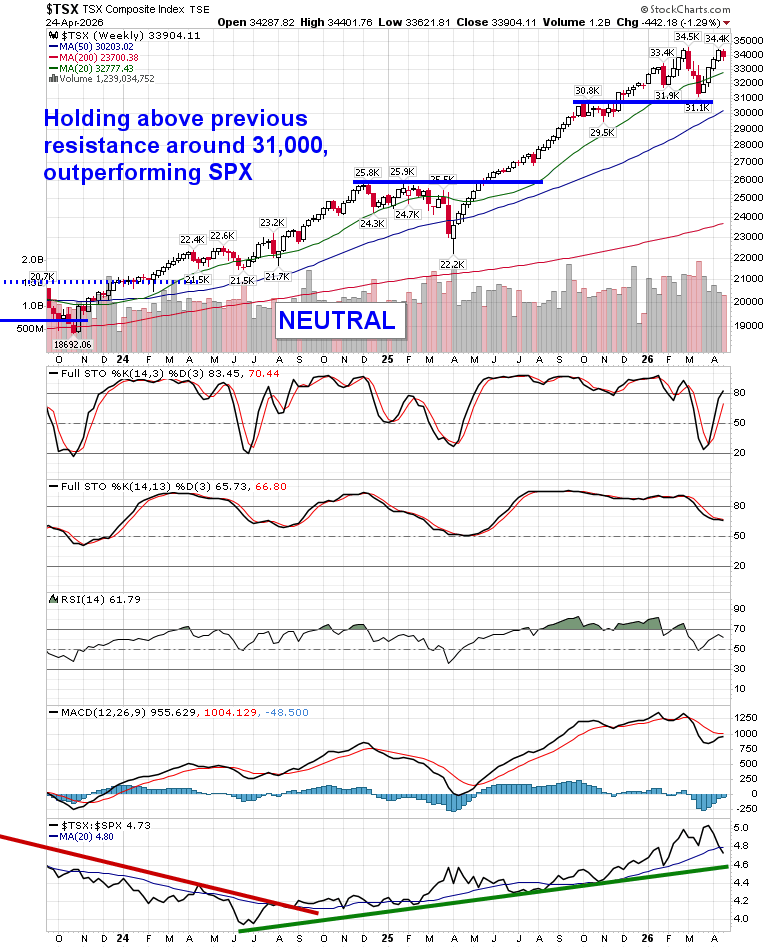
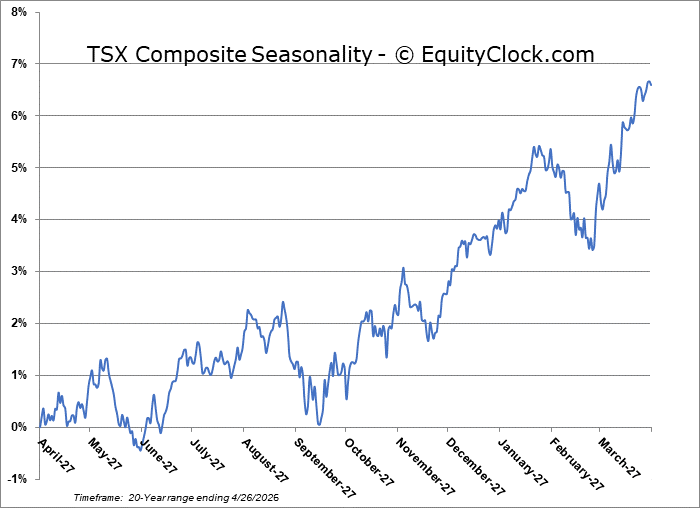
TSE Composite
| Sponsored By... |

|


