Stock Market Outlook for May 29, 2026

Defense stocks looking set to defend portfolios this summer.
*** Stocks highlighted are for information purposes only and should not be considered as advice to purchase or to sell mentioned securities. As always, the use of technical and fundamental analysis is encouraged in order to fine tune entry and exit points to average seasonal trends.
Stocks Entering Period of Seasonal Strength Today:
Subscribers Click on the relevant link to view the full profile. Not a subscriber? Signup here.
Stock Highlight: |
|

Johnson & Johnson (NYSE:JNJ) Seasonal Chart |
|

Cintas Corp. (NASD:CTAS) Seasonal Chart

Procter & Gamble Co. (NYSE:PG) Seasonal Chart

C4 Therapeutics Inc. (NASD:CCCC) Seasonal Chart

National Retail Properties Inc. (NYSE:NNN) Seasonal Chart

Clearwater Paper Corp. (NYSE:CLW) Seasonal Chart

Hannon Armstrong Sustainable Infastructure Capital Inc. (NYSE:HASI) Seasonal Chart
Disclaimer: Comments and opinions offered in this report are for information only. They should not be considered as advice to purchase or to sell mentioned securities. Data offered is believed to be accurate, but is not guaranteed.
The Markets
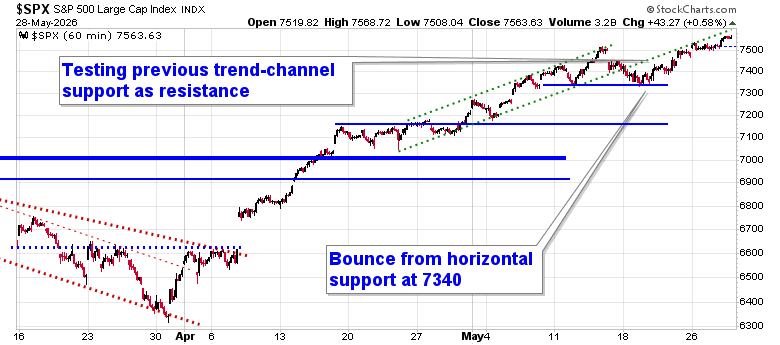
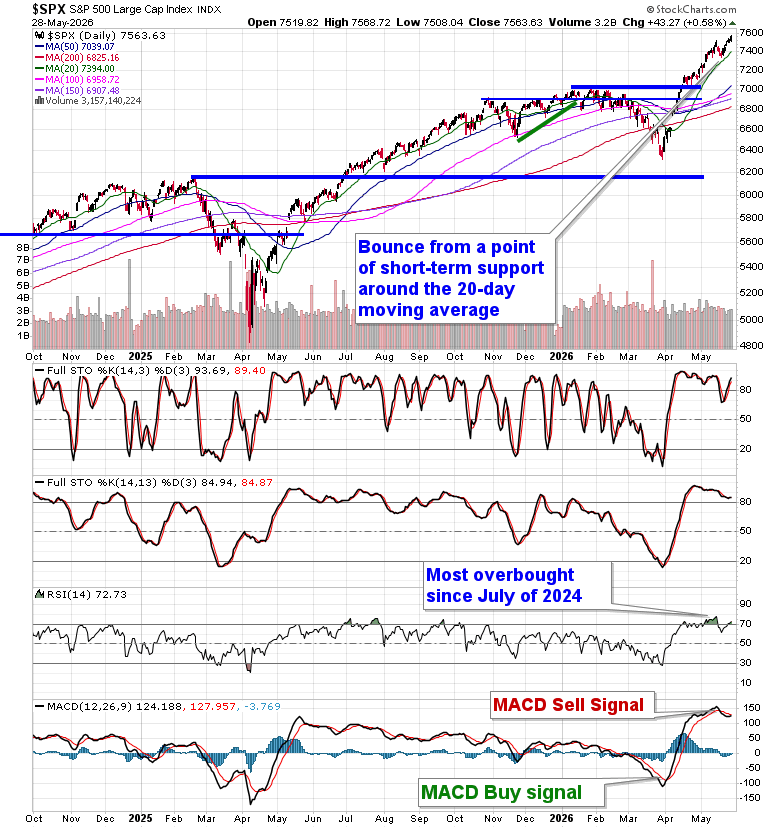
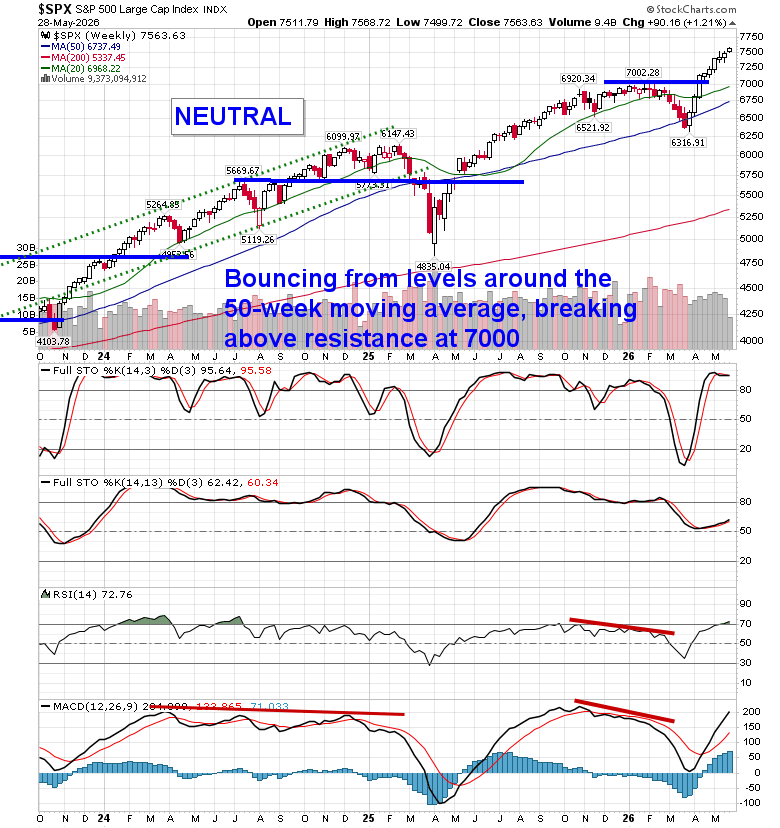
Further headlines that a deal may be close to being struck between the US and Iran kept stocks afloat into the Thursday session. The S&P 500 Index closed higher by six-tenths of one percent, continuing this grind higher below previous rising trendline support that elevated the large-cap benchmark in the first half of May. We continue to eye the level of horizontal support at 7340, a breakdown below which would project a move back towards the upper limit of the end of April consolidation span around 7150. While the character of the market remains where levels of resistance hold less weight than levels of support, there are certainly fractures around the periphery as breadth in the market narrows. Overbought readings are beginning to flash again as the Relative Strength Index (RSI) moves back above 70. In the Seasonal Advantage Portfolio that we manage for clients at CastleMoore, we continue to hit new high watermarks and we have prepared for a more volatile/risk-off market framework for the back half of May and into the month of June. The conflict/deal in Iran is the ongoing wildcard and the cues that we have been following that warranted moving towards a more defensive posture in risk assets have not gone away (although our thesis surrounding them is being strained as levels of support for yields and oil are being pressured). Subscribers can view the themes in our chart books to either Accumulate or Avoid that we continue to gear portfolios towards.
Today, in our Market Outlook to subscribers, we discuss the following:
- US Durable Goods Orders and the investment implications within
- New Home Sales and what it has to say about the consumer
- Weekly Jobless Claims and the health of the labor market
Subscribers can look for this report in their inbox or by clicking on the following link and logging in: Market Outlook for May 29
Not signed up yet? Subscribe now to receive full access to all of the research and analysis that we publish
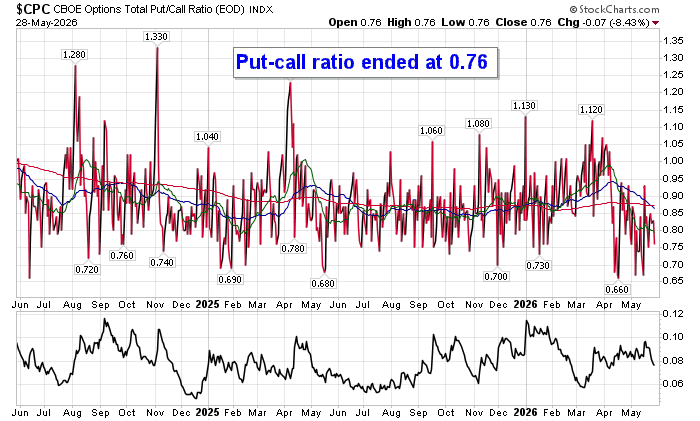
Sentiment on Thursday, as gauged by the put-call ratio, ended bullish at 0.76.
Seasonal charts of companies reporting earnings today:


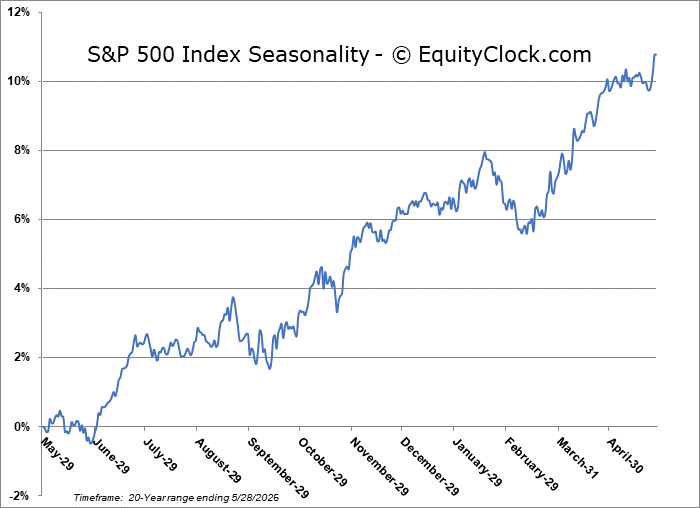
S&P 500 Index
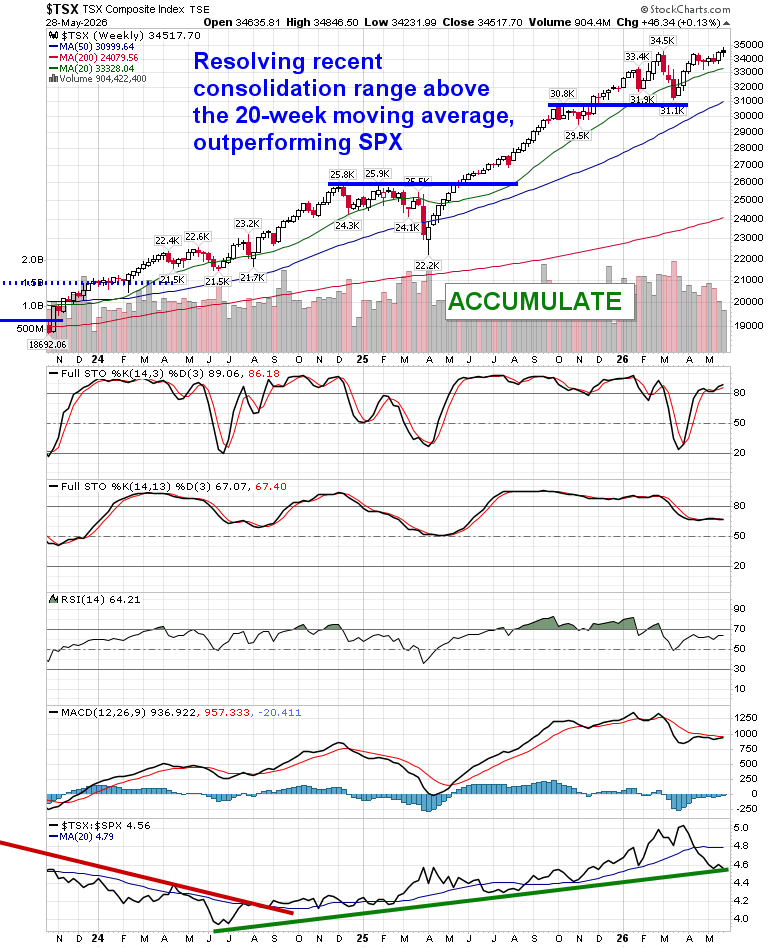
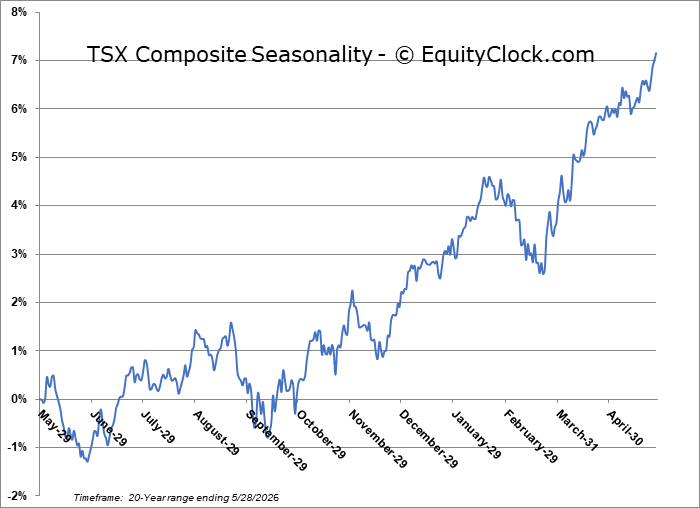
TSE Composite
| Sponsored By... |

|


