Stock Market Outlook for June 2, 2026

Oil and yields re-ememging as threats to the market, particularly in high-flying tech names.
*** Stocks highlighted are for information purposes only and should not be considered as advice to purchase or to sell mentioned securities. As always, the use of technical and fundamental analysis is encouraged in order to fine tune entry and exit points to average seasonal trends.
Stocks Entering Period of Seasonal Strength Today:
Subscribers Click on the relevant link to view the full profile. Not a subscriber? Signup here.
Stock Highlight: |
|

Merck & Co., Inc. (NYSE:MRK) Seasonal Chart |
|
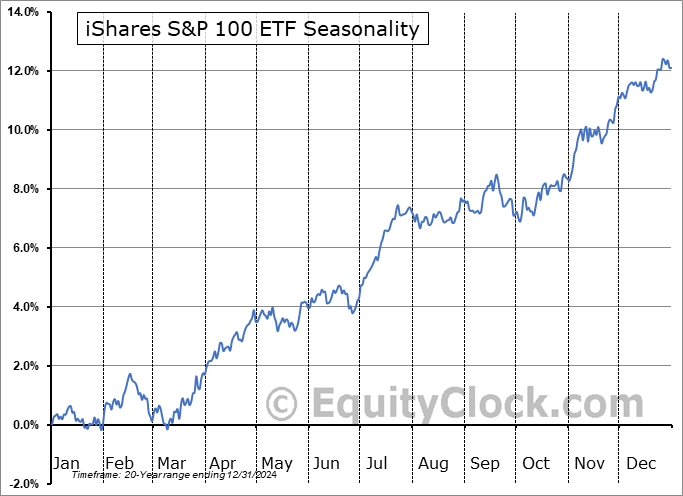
iShares S&P 100 ETF (NYSE:OEF) Seasonal Chart

Spin Master Corp. (TSE:TOY.TO) Seasonal Chart
Disclaimer: Comments and opinions offered in this report are for information only. They should not be considered as advice to purchase or to sell mentioned securities. Data offered is believed to be accurate, but is not guaranteed.
The Markets
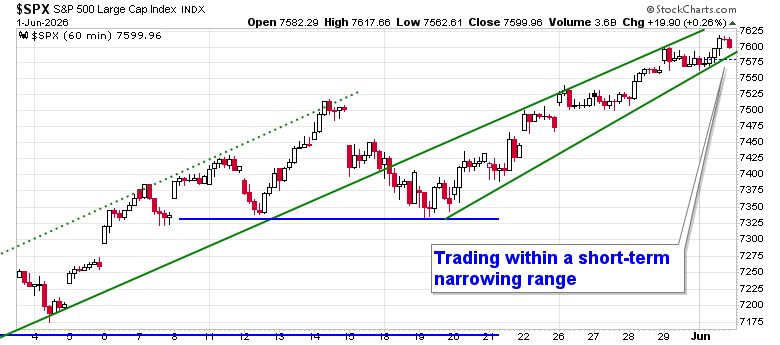
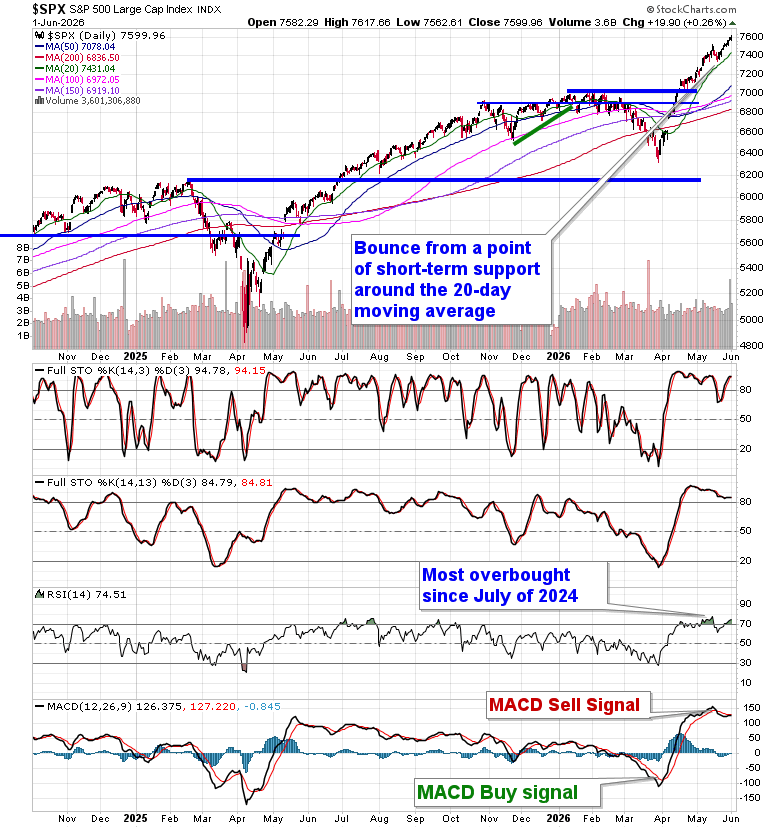
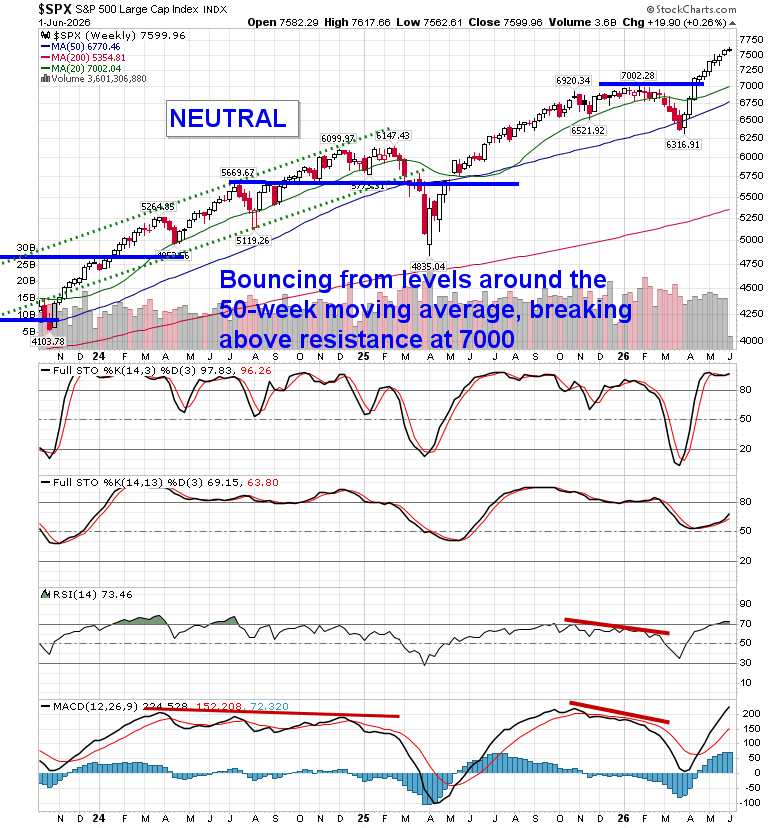
Despite uncertainty pertaining to the state of negotiations (or lack therof) between Iran and the US, ongoing strength in the Technology sector kept broad equity benchmarks afloat into the start of the new month. The S&P 500 Index ended up by a quarter of one percent, continuing this grind higher below previous rising trendline support that elevated the large-cap benchmark in the first half of May. The benchmark has developed a new, narrowing rising span that doesn’t really seem to have much momentum/range behind it, but it is benefiting from the FOMO (fear of missing out) trade as investors chase performance. The upper limit of the narrowing range can be pegged at 7650, while the lower limit of the span now sits around 7590; a break below the lower limit of the setup presents the prospect of seeing a retracement of a large portion of grind higher in the past couple of weeks. The lack of volume in the market since the March lows suggests that investors have been locked out of the market, conducive to this incremental grind higher, but it also creates vulnerability given that investors are not broadly engaged. While the character of the market remains where levels of resistance hold less weight than levels of support, there are certainly fractures around the periphery as breadth in the market narrows. Overbought readings continue to flash as the Relative Strength Index (RSI) moves further above 70. In the Seasonal Advantage Portfolio that we manage for clients at CastleMoore, we continue to hit new high watermarks and we have prepared for a more volatile/risk-off market framework (which admittedly has dampened our performance in the tech-led euphoria of recent weeks). The conflict/deal in Iran is the ongoing wildcard and the cues that we have been following that warranted moving towards a more defensive posture in risk assets have not gone away (and, arguably, our thesis was reconfirmed on Monday). Subscribers can view the themes in our chart books to either Accumulate or Avoid that we continue to gear portfolios towards.
Want to know which areas of the market to buy or sell? Our Weekly Chart Books have just been updated, providing a clear Accumulate, Avoid, or Neutral rating for currencies, cryptocurrencies, commodities, broad markets, and subsectors/industries of the market. Subscribers can login and click on the relevant links to access.
- Currencies
- Cryptocurrencies
- Commodities
- Major Benchmarks
- Sub-sectors / Industries
- ETFs: Bonds | Commodities | Equity Markets | Industries | Sectors
Subscribe now.
Today, in our Market Outlook to subscribers, we discuss the following:
- Our weekly chart books update, along with our list of all segments of the market to either Accumulate or Avoid
- Other Notes
Subscribers can look for this report in their inbox or by clicking on the following link and logging in: Market Outlook for June 2
Not signed up yet? Subscribe now to receive full access to all of the research and analysis that we publish
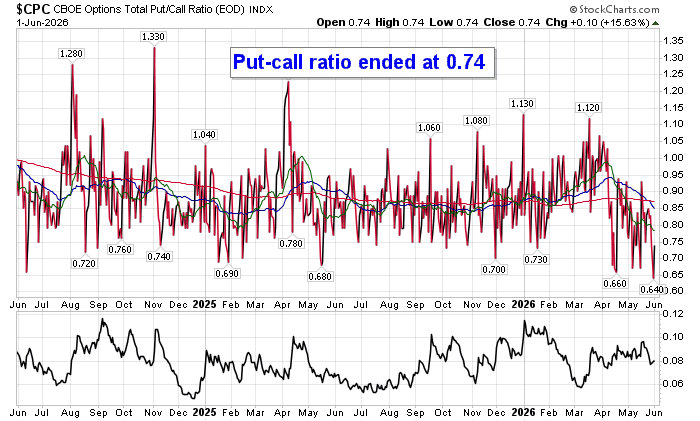
Sentiment on Monday, as gauged by the put-call ratio, ended bullish at 0.74.
Seasonal charts of companies reporting earnings today:


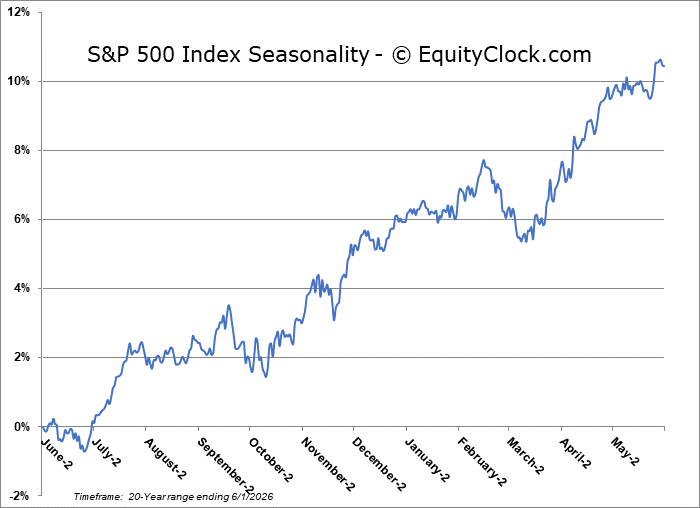
S&P 500 Index
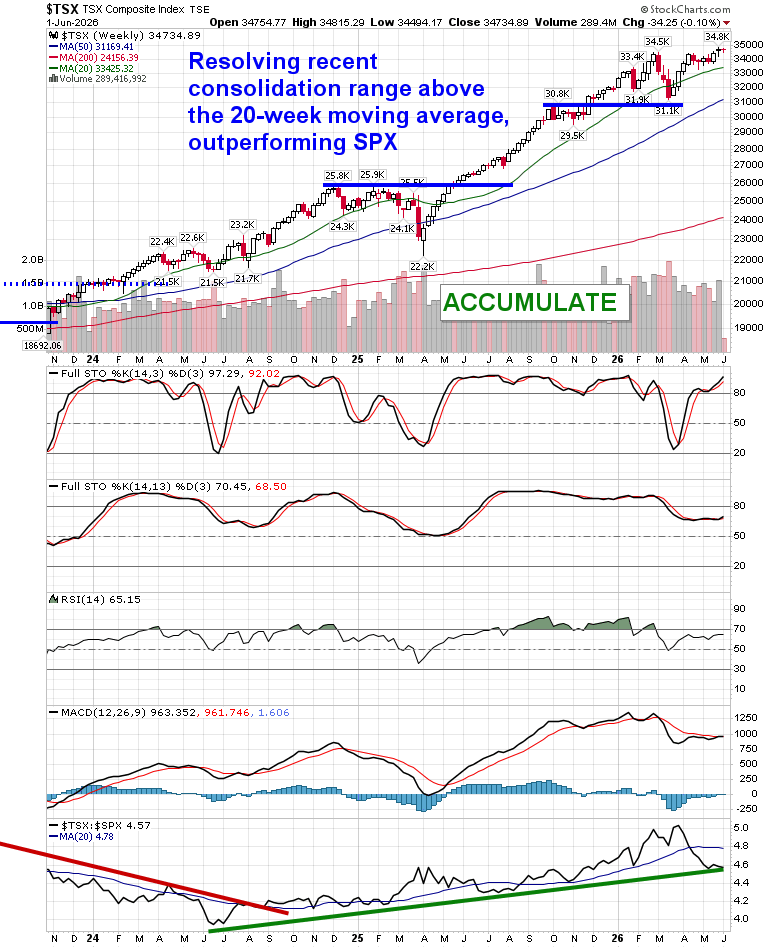
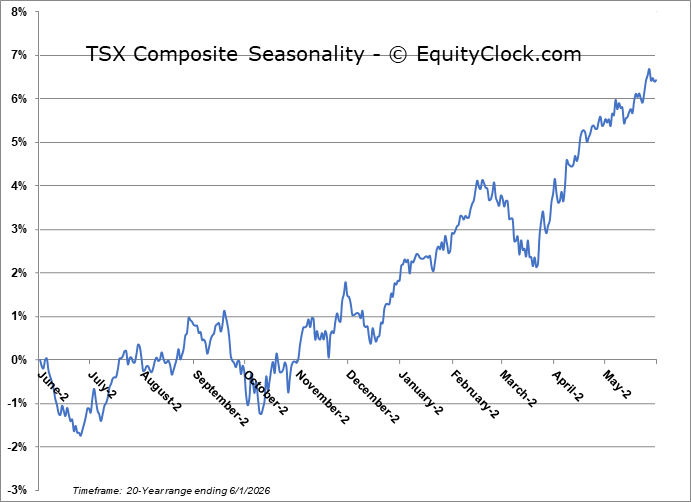
TSE Composite
| Sponsored By... |

|


