Stock Market Outlook for June 5, 2026

Playing on the right side of the seasonal trade in Health Care and Defense.
*** Stocks highlighted are for information purposes only and should not be considered as advice to purchase or to sell mentioned securities. As always, the use of technical and fundamental analysis is encouraged in order to fine tune entry and exit points to average seasonal trends.
Stocks Entering Period of Seasonal Strength Today:
Subscribers Click on the relevant link to view the full profile. Not a subscriber? Signup here.
Stock Highlight: |
|

EastGroup Properties, Inc. (NYSE:EGP) Seasonal Chart |
|

Invesco Bond Fund (NYSE:VBF) Seasonal Chart

Personalis Inc. (NASD:PSNL) Seasonal Chart

First Asset Tech Giants Covered Call ETF (TSE:TXF/B.TO) Seasonal Chart

iShares Morningstar Large-Cap ETF (NYSE:ILCB) Seasonal Chart

Vanguard Mega Cap ETF (NYSE:MGC) Seasonal Chart

BlackRock Taxable Municipal Bond Trust (NYSE:BBN) Seasonal Chart
Disclaimer: Comments and opinions offered in this report are for information only. They should not be considered as advice to purchase or to sell mentioned securities. Data offered is believed to be accurate, but is not guaranteed.
The Markets
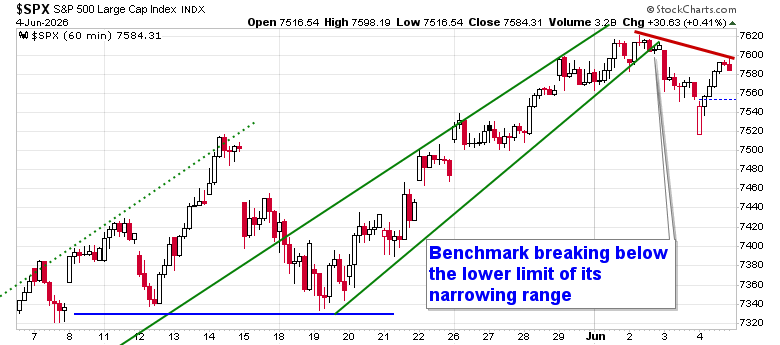
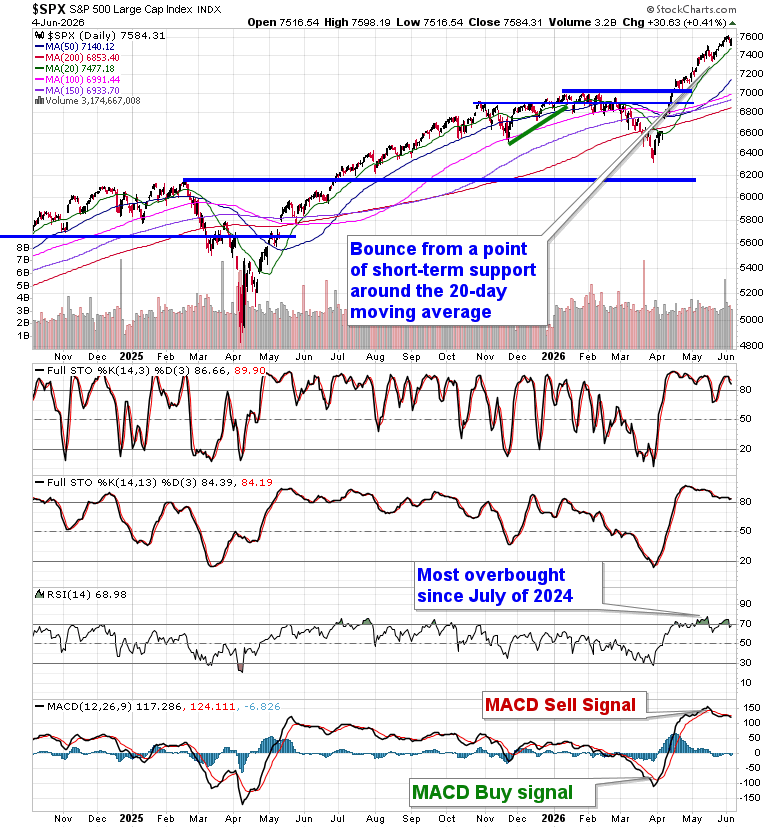
Stocks were generally higher on Thursday, despite weakness in the technology sector following a disappointing reaction to earnings from Broadcom (AVGO). The S&P 500 Index added just over four-tenths of one percent, trading back to the breakdown point from the narrowing rising span of recent weeks. The conclusion to the narrowing rising span presents the prospect of seeing a retracement of a large portion of the grind higher from the past couple of weeks. While the character of the market remains where levels of resistance hold less weight than levels of support, waning momentum around the 7600 level provides something to scrutinize as we navigate into the period of weakness that the month of June is known for. Short-term support persists around the rising 20-day moving average (7,477). In the Seasonal Advantage Portfolio that we manage for clients at CastleMoore, we continue to hit new high watermarks (even during this week) and we have prepared for a more volatile/risk-off market framework (which admittedly has dampened our performance in the tech-led euphoria of recent weeks). The conflict/deal in Iran is the ongoing wildcard and the cues that we have been following that warranted moving towards a more defensive posture in risk assets have not gone away (and, arguably, our thesis was reconfirmed on Monday). Subscribers can view the themes in our chart books to either Accumulate or Avoid that we continue to gear portfolios towards.
Today, in our Market Outlook to subscribers, we discuss the following:
- Health Care showing healthy performance
- Defense defending an important level of support
- The end of mega-cap dominance?
- Weekly Jobless Claims and the health of the labor market
- A look ahead at what to expect from May’s NonFarm Payroll report
Subscribers can look for this report in their inbox or by clicking on the following link and logging in: Market Outlook for June 5
Not signed up yet? Subscribe now to receive full access to all of the research and analysis that we publish
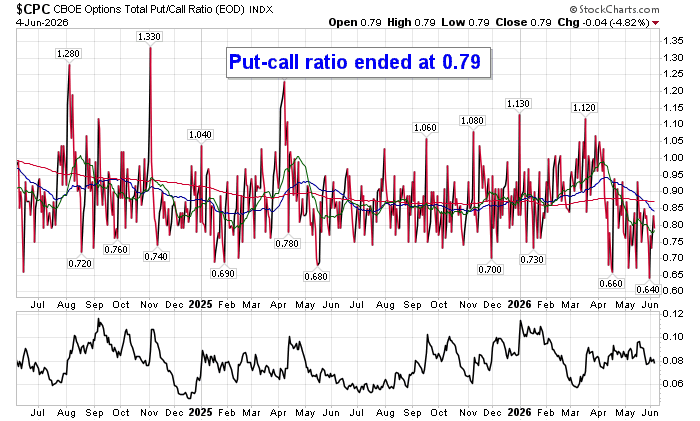
Sentiment on Thursday, as gauged by the put-call ratio, ended bullish at 0.79.
Seasonal charts of companies reporting earnings today:


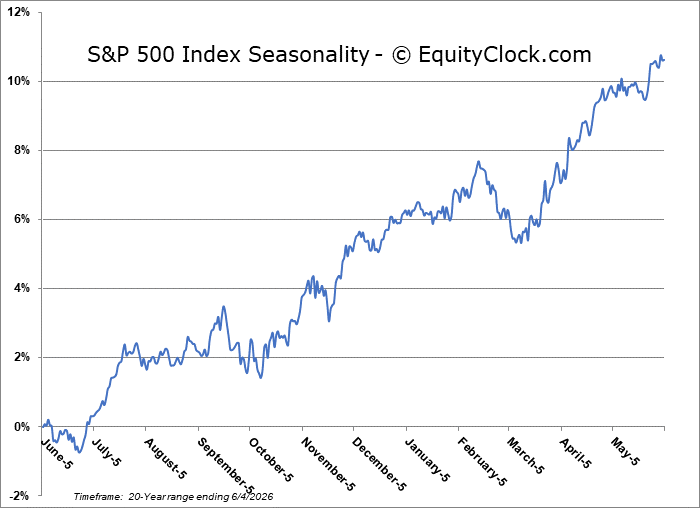
S&P 500 Index
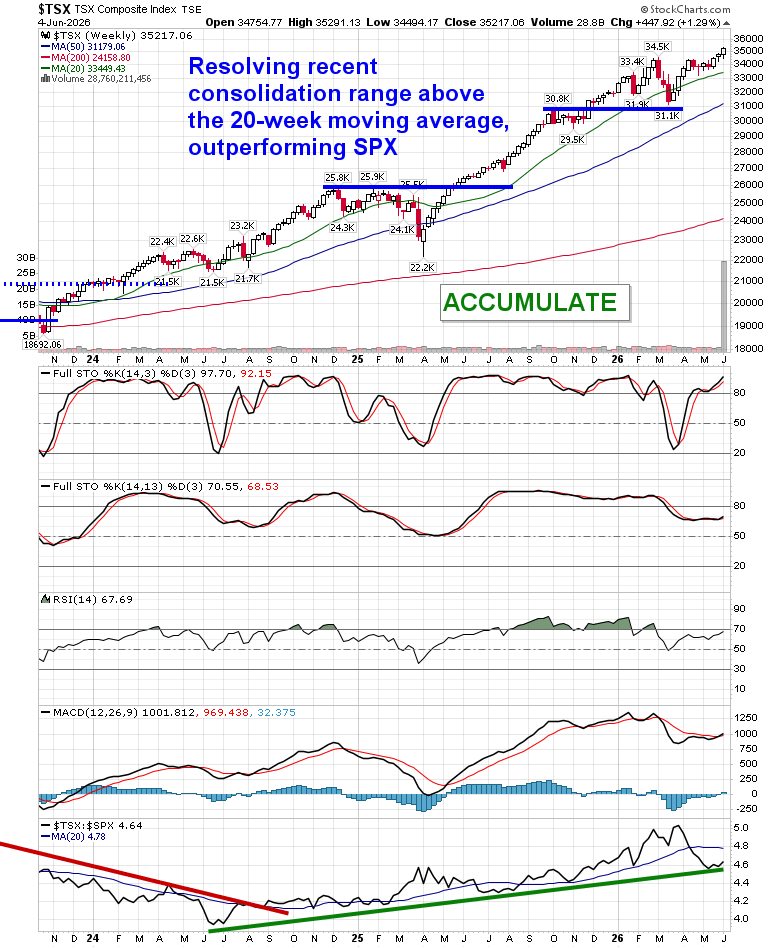
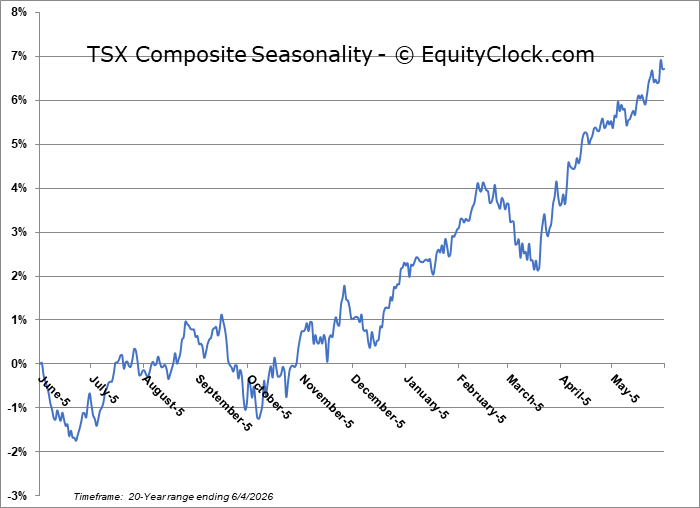
TSE Composite
| Sponsored By... |

|


