Stock Market Outlook for September 14, 2026

Bad breadth, increasing odds of a rate hike, and a discerning consumer mentality highlight the risks/burdens in the market heading into the peak period of volatility for stocks.
*** Stocks highlighted are for information purposes only and should not be considered as advice to purchase or to sell mentioned securities. As always, the use of technical and fundamental analysis is encouraged in order to fine tune entry and exit points to average seasonal trends.
Stocks Entering Period of Seasonal Strength Today:
Subscribers Click on the relevant link to view the full profile. Not a subscriber? Signup here.

iShares U.S. Aerospace & Defense ETF (NYSE:ITA) Seasonal Chart

Oil Dri Corp. Of America (NYSE:ODC) Seasonal Chart

Phillips 66 (NYSE:PSX) Seasonal Chart

Blackrock, Inc. (NYSE:BLK) Seasonal Chart

HP Inc. (NYSE:HPQ) Seasonal Chart

Industrial-Alliance Life Insurance Co. (TSE:IAG.TO) Seasonal Chart

BP Amoco PLC (NYSE:BP) Seasonal Chart
Disclaimer: Comments and opinions offered in this report are for information only. They should not be considered as advice to purchase or to sell mentioned securities. Data offered is believed to be accurate, but is not guaranteed.
The Markets
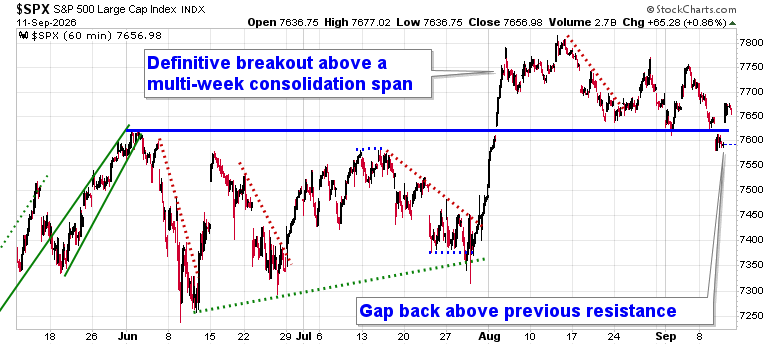
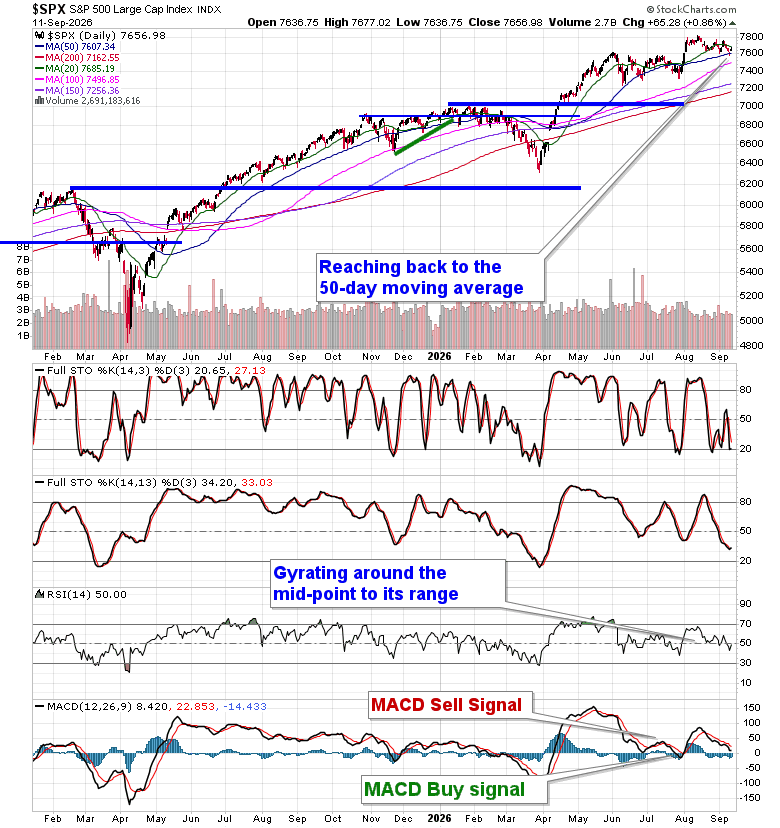
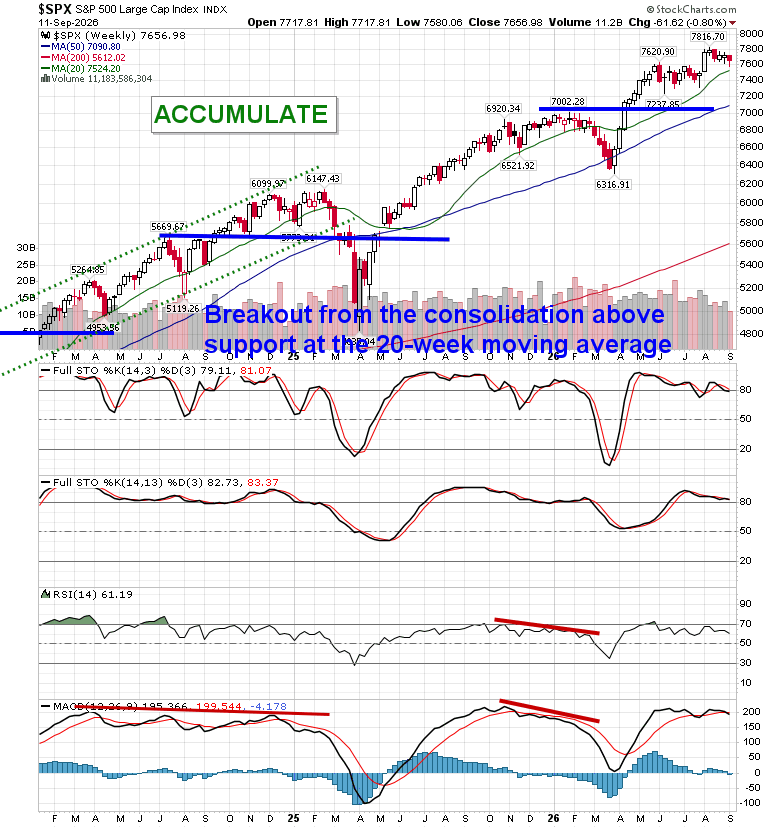
Stocks shook off increased odds of a rate hike at next week’s FOMC meeting, trading higher during the Friday session. The S&P 500 Index jumped by 0.86%, gapping back above previous resistance and implied support at 7620. Next level of support below 7620 can be pegged at the mid-July highs around 7575, a break of which would start to invalidate the short-term bull-flag pattern that we have been highlighting in recent weeks. The 50-day moving average (~7607) that was cracked through the middle of last week has been retaken as the bulls attempt to remain in control of the tape. Historically, the most volatile period for equity performance in the year is just days away, therefore heightened caution is becoming appropriate. In the Seasonal Advantage Portfolio that we manage for clients at CastleMoore, we continue to hold an elevated exposure to stocks, aligning with the optimism that the manufacturing economy is expressing, but our patience is growing thin and we may need to adjust should the persistency of headwinds against stocks (outside of energy) endure. Subscribers can view what we are targeting in our list of market segments to either Accumulate or Avoid.
Today, in our Market Outlook to subscribers, we discuss the following:
- Weekly look at the large-cap benchmark
- Concerning market breadth
- US Consumer Price Index and the investment implications within
- Interest rates
Subscribers can look for this report in their inbox or by clicking on the following link and logging in: Market Outlook for September 14
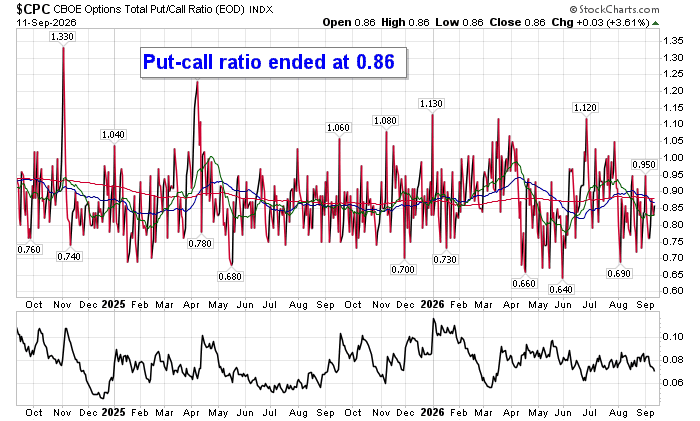
Sentiment on Friday, as gauged by the put-call ratio, ended bullish at 0.86.
Seasonal charts of companies reporting earnings today:


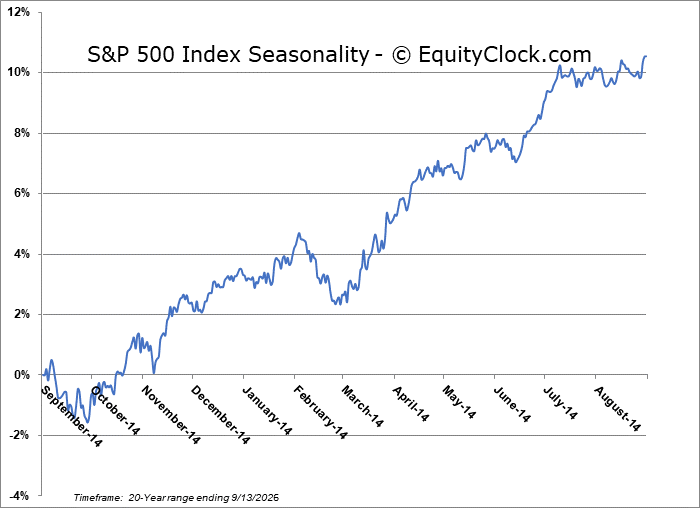
S&P 500 Index
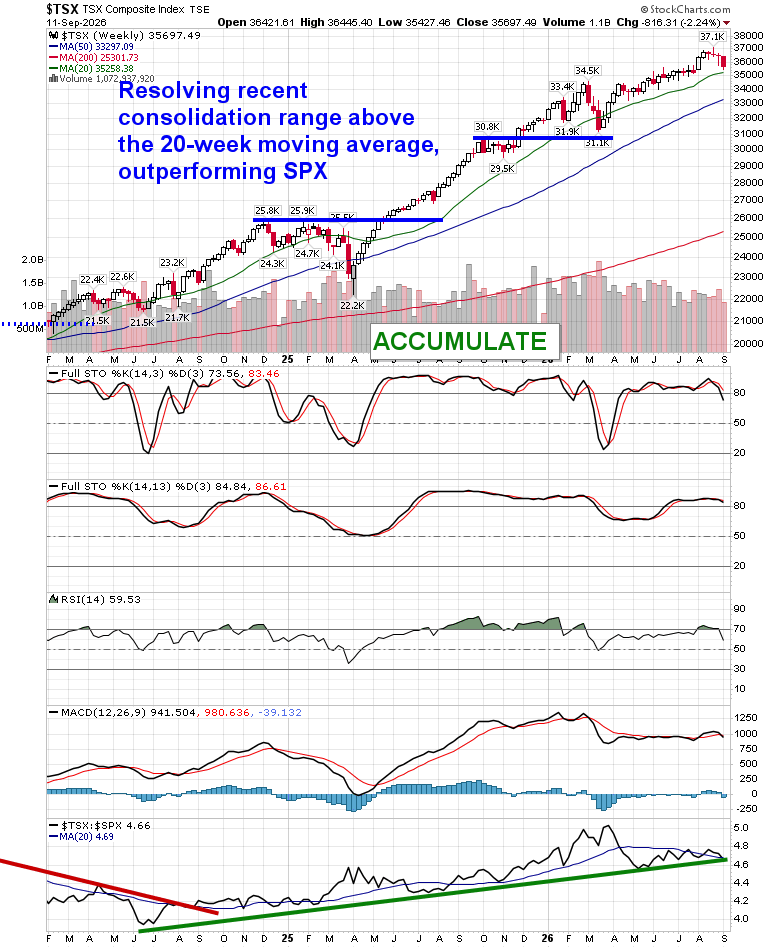
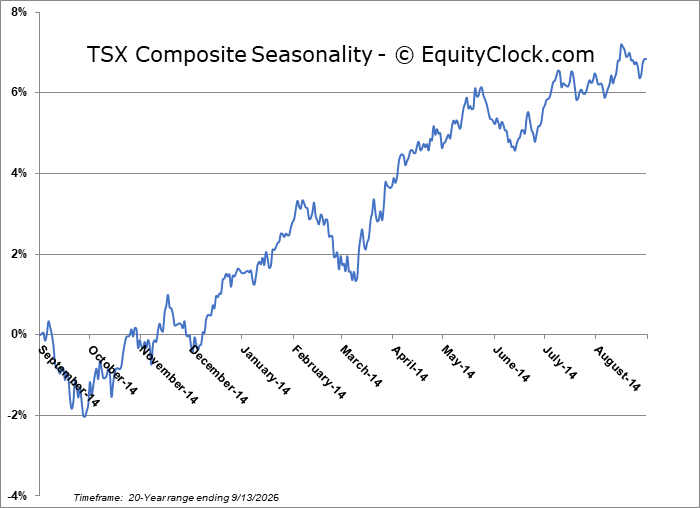
TSE Composite
| Sponsored By... |

|


