Stock Market Outlook for October 1, 2026

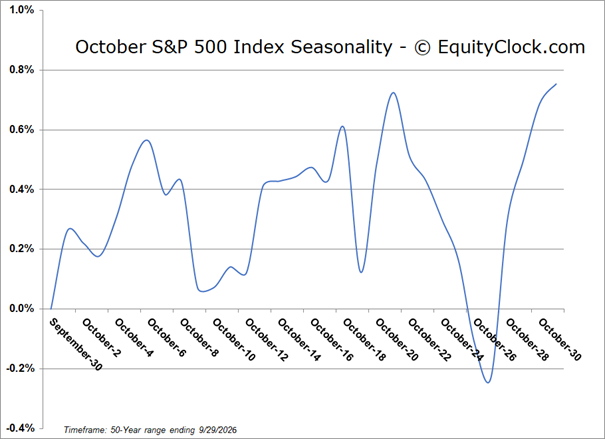
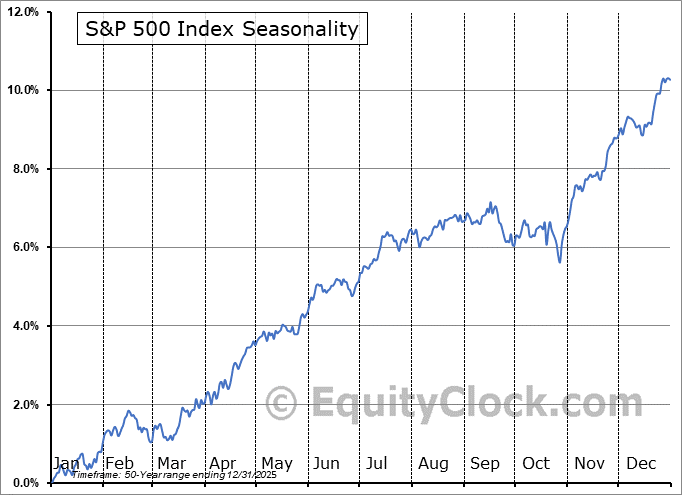
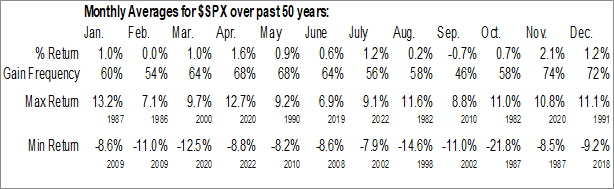
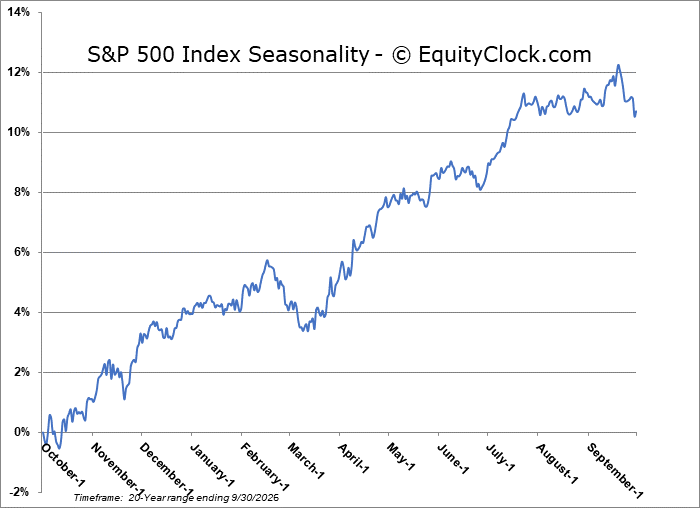
The S&P 500 Index has averaged a return of 0.7% in October over the past 50 years with the frequency of gains for the month coming in at 58%.
*** Stocks highlighted are for information purposes only and should not be considered as advice to purchase or to sell mentioned securities. As always, the use of technical and fundamental analysis is encouraged in order to fine tune entry and exit points to average seasonal trends.
Stocks Entering Period of Seasonal Strength Today:
Subscribers Click on the relevant link to view the full profile. Not a subscriber? Signup here.
Stock Highlight: |
|

Qualys, Inc. (NASD:QLYS) Seasonal Chart |
|

Korn Ferry Intl (NYSE:KFY) Seasonal Chart

Vanguard Financials ETF (NYSE:VFH) Seasonal Chart

Global Industrial Company (NYSE:GIC) Seasonal Chart
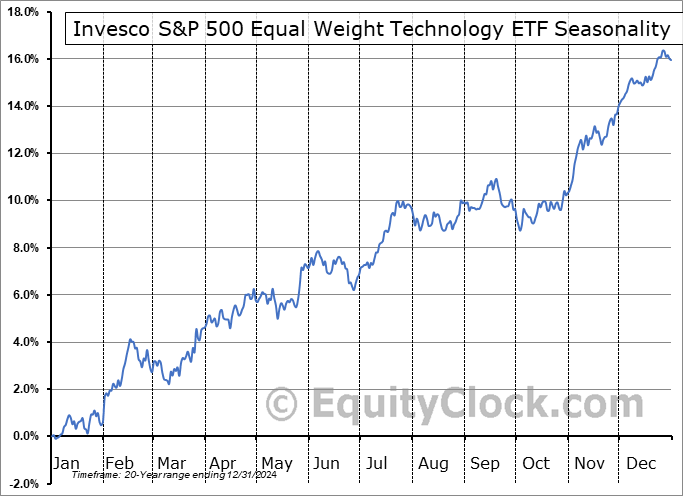
Invesco S&P 500 Equal Weight Technology ETF (AMEX:RSPT) Seasonal Chart
Disclaimer: Comments and opinions offered in this report are for information only. They should not be considered as advice to purchase or to sell mentioned securities. Data offered is believed to be accurate, but is not guaranteed.
The Markets
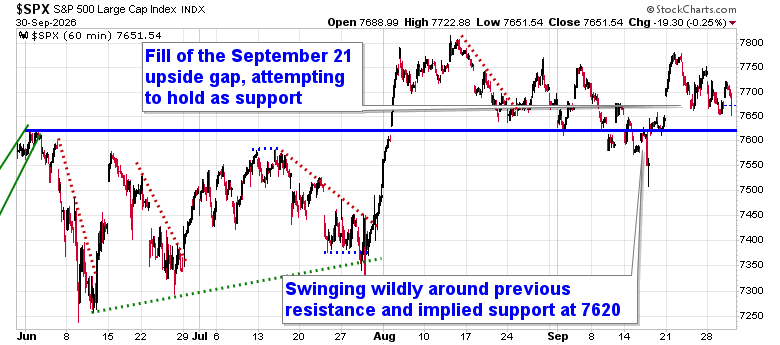
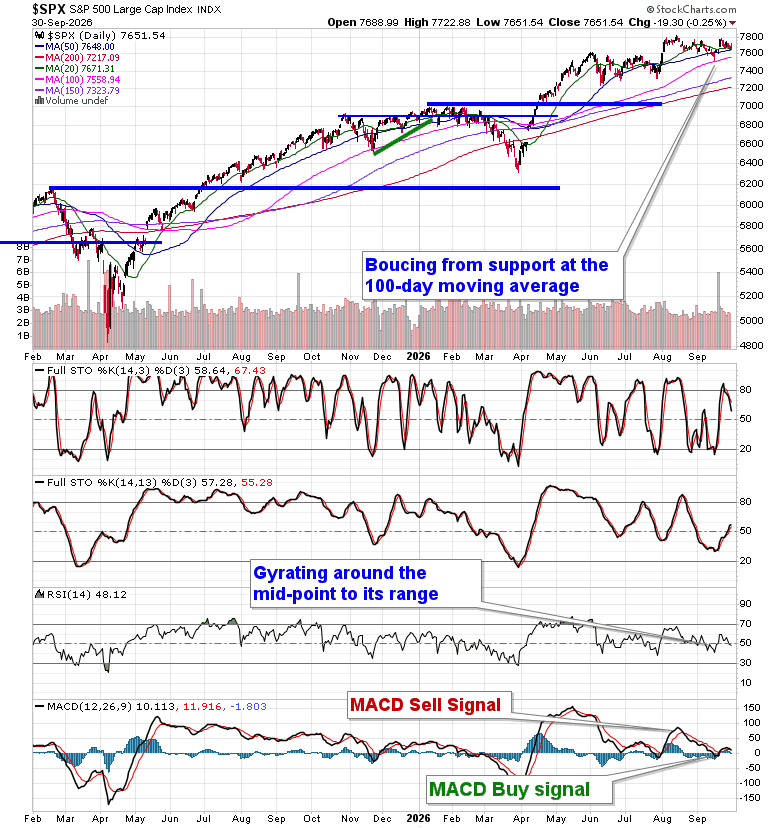
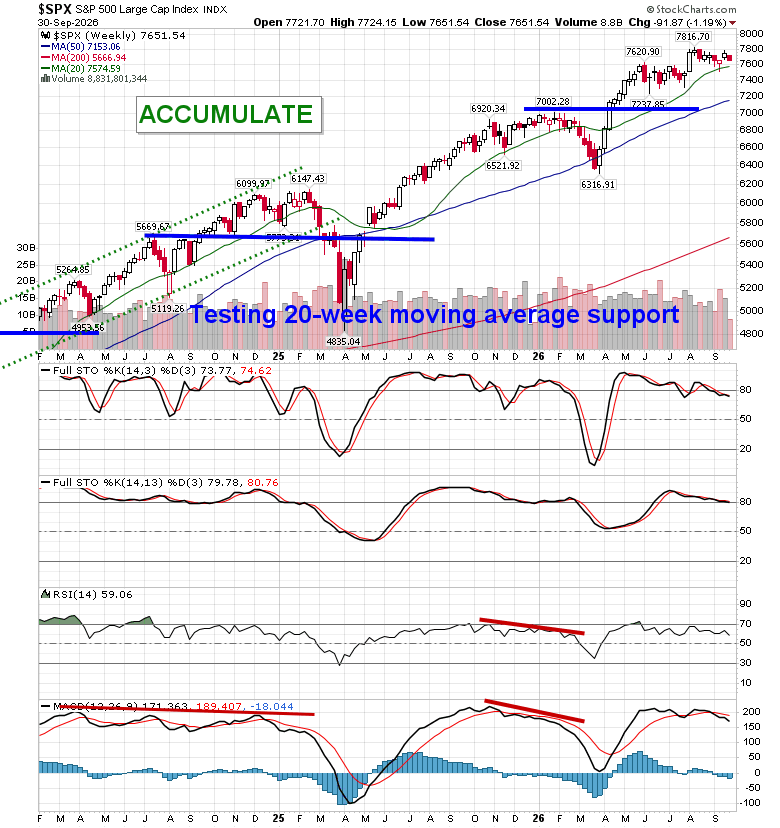
Stocks closed lower in the last session of September as the rise in interest rate remained top of mind for investors heading into the last quarter of the year. The S&P 500 Index slipped by a quarter of one percent, still holding the upside open gap (a zone of support) charted a week ago Monday between 7650 and 7690. Previous resistance remains as implied support at 7620. The moves in the past couple of days certainly cloud the contention of the start of a new ultra-short-term rising trend following the declining path that has been charted since the middle of August. Ultimately, more of the same consolidation that the benchmark has been subjected to for months continues. Historically, this is the most volatile period for equity performance that spans the last two weeks of September, therefore heightened caution has been appropriate, but we have been pushing back against the negativity that is typical for this timeframe (see our September 18th report). We continue to examine what may be the appropriate stance in equity positioning for the month of October, but we have started to de-risk in our Super Simple Seasonal Portfolio. Subscribers can stay on top of our thinking and what we are watching in our regular reports, as well as view what we are targeting in our list of market segments to either Accumulate or Avoid.
For the month ahead, while often thought of as a weak period for equities given some notable meltdowns that have occurred (eg. October 1987), the month of October is, in fact, a positive month, on average, for stocks. The S&P 500 Index has averaged a return of 0.7% in this first month of the fourth quarter over the past 50 years. The frequency of gains for the month is 58%. Returns have ranged from a loss of 21.8% in October of 1987 to a gain of 11.0% in October of 1982. Gains tend to be dominated by the first few days and the last few days of the month as investors jockey for position around third quarter earnings season. The middle of the month is where the erratic trading has been seen as investors react to the earnings themselves, selling the news after buying the rumour. The average low for the large-cap benchmark is on October 27th, leading into the best six months for stocks that peaks on May 5th, on average, of the following year.
Just Released…
Our monthly report for October is out, providing you with everything that you need to know to navigate the market through the month(s) ahead.
Highlights in this report include:
- Equity market tendencies in the month of October
- Strongest period for stocks of the 4-year election cycle
- Stealth equity buying through the first half of September mitigating typical volatile tendencies
- Manufacturer optimism
- Yield and Dollar Dynamics
- Market is in a fragile state heading into October
- Yield Spreads are narrowing, weighing on Bank stocks
- Booking Profits in Energy
- Waning upside momentum for Oil at resistance
- Canadian Stocks
- Inflationary pressures in the economy not just from the rise in energy prices this year
- Waning enthusiasm towards software stocks following their recent rally
- Our list of all segments of the market to either Accumulate or Avoid, along with relevant ETFs
- Positioning for the months ahead
- Sector Reviews and Ratings
- Stocks that have Frequently Gained in the Month of October
- Notable Stocks and ETFs Entering their Period of Strength in October
Subscribers can look for this 106-page report in their inbox and in the report archive.
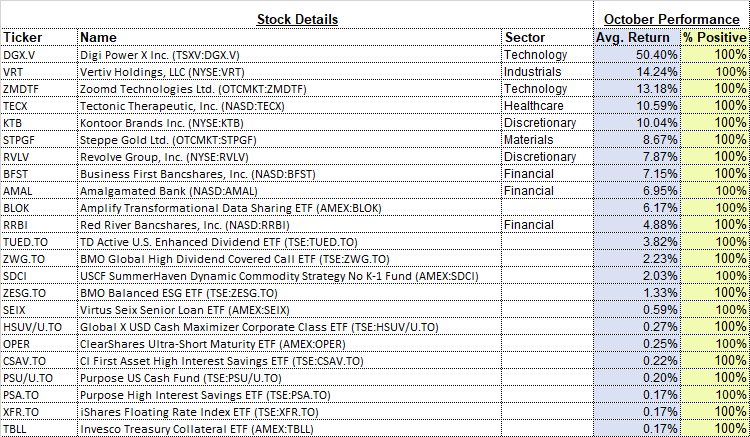
With the new month upon us and as we celebrate the release of our monthly report for October, today we release our screen of all of the stocks that have gained in every October over their trading history. While we at Equity Clock focus on a three-pronged approach (seasonal, technical, and fundamental analysis) to gain exposure to areas of the market that typically perform well over intermediate (2 to 6 months) timeframes, we know that stocks that have a 100% frequency of success for a particular month is generally of interest to those pursuing a seasonal investment strategy. Below are the results:
And how about those securities that have never gained in this tenth month of the year, here they are:
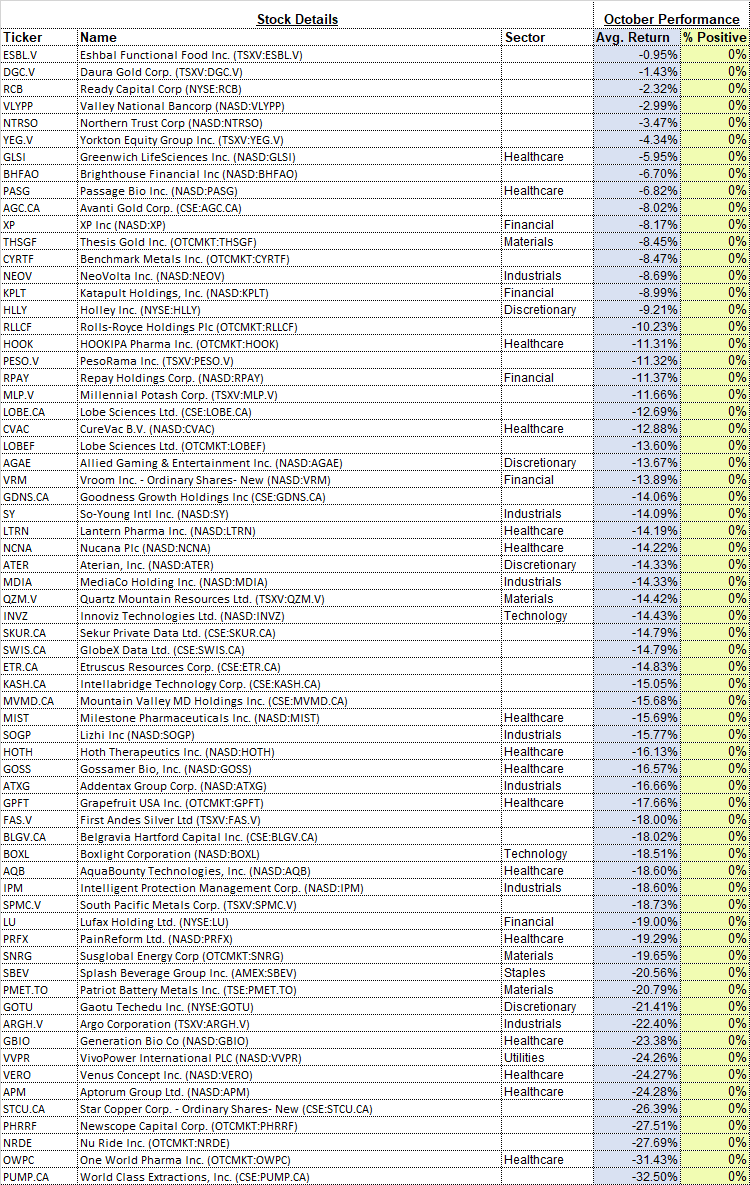
*Note: None of the results highlighted above have the 20 years of data that we like to see in order to accurately gauge the annual recurring, seasonal influences impacting an investment, therefore the reliability of the results should be questioned. We present the above list as an example of how our downloadable spreadsheet available to yearly subscribers can be filtered. For a more extensive list of high frequency (70% ) gainers for the month of October, please refer to our monthly report.
Today, in our Market Outlook to subscribers, we discuss the following:
- Monthly look at the large-cap benchmark
- Tendencies for stocks in the month of October
- Securities that have gained or lost in every October over their trading history
- Market Leverage and what it could mean to the equity market
- Additional Thoughts
Subscribers can look for this report in their inbox or by clicking on the following link and logging in: Market Outlook for October 1
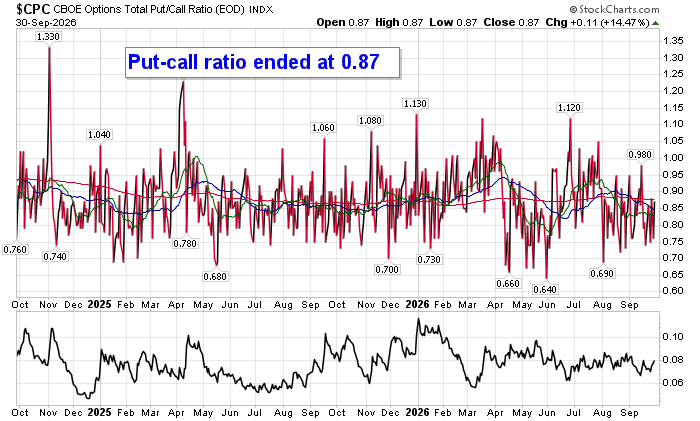
Sentiment on Wednesday, as gauged by the put-call ratio, ended bullish at 0.87.
Seasonal charts of companies reporting earnings today:


S&P 500 Index
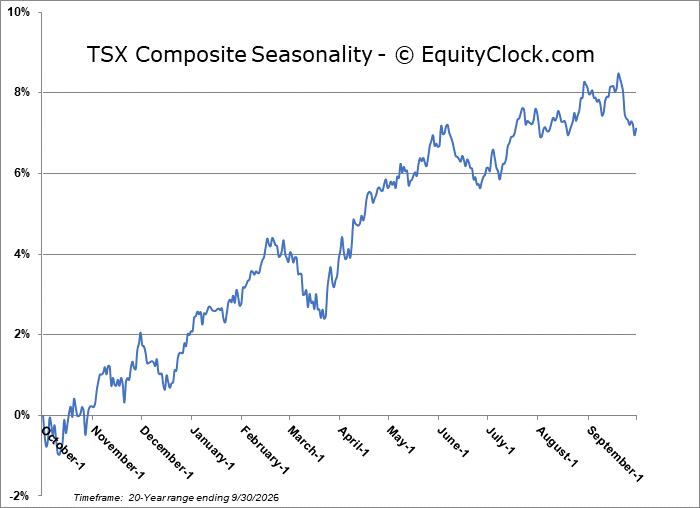
TSE Composite
| Sponsored By... |

|


