Stock Market Outlook for April 23, 2026

Meme stock frenzy showing initial signs of fatigue.
*** Stocks highlighted are for information purposes only and should not be considered as advice to purchase or to sell mentioned securities. As always, the use of technical and fundamental analysis is encouraged in order to fine tune entry and exit points to average seasonal trends.
Stocks Entering Period of Seasonal Strength Today:
Subscribers Click on the relevant link to view the full profile. Not a subscriber? Signup here.
Stock Highlight: |
|

Intuitive Surgical, Inc. (NASD:ISRG) Seasonal Chart |
|

XCel Brands, Inc. (NASD:XELB) Seasonal Chart
Disclaimer: Comments and opinions offered in this report are for information only. They should not be considered as advice to purchase or to sell mentioned securities. Data offered is believed to be accurate, but is not guaranteed.
The Markets
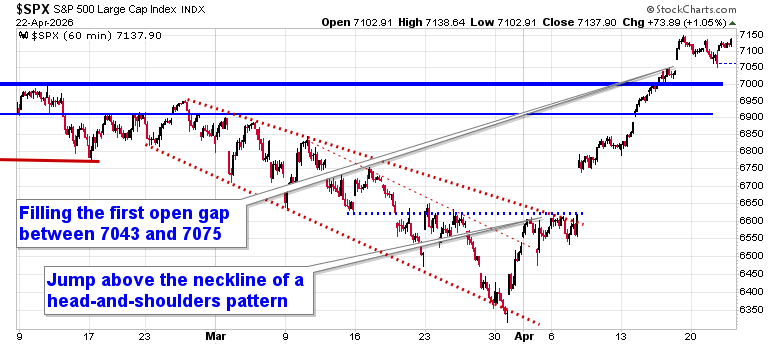
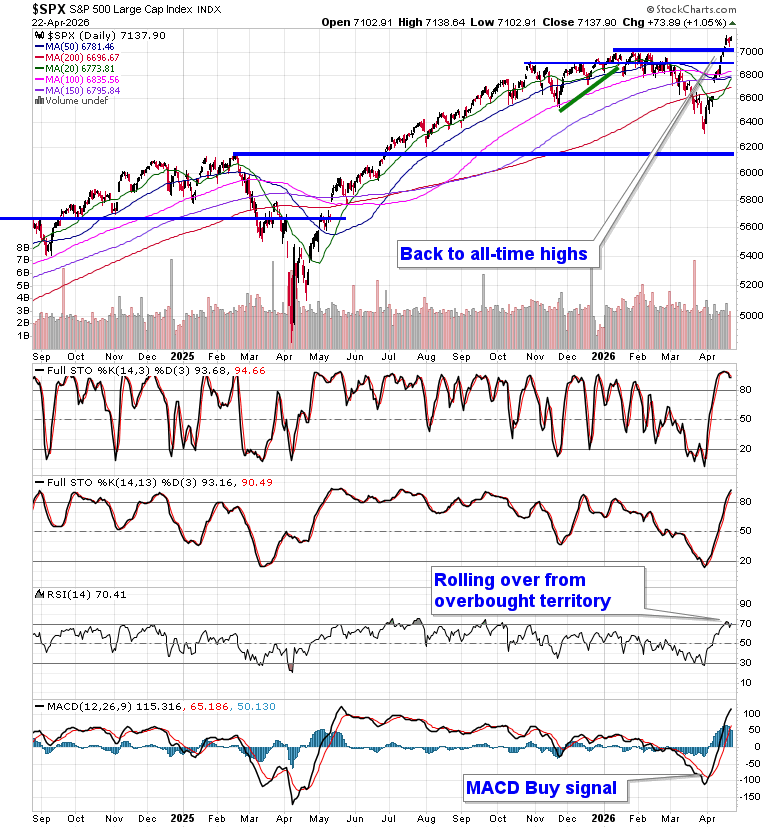
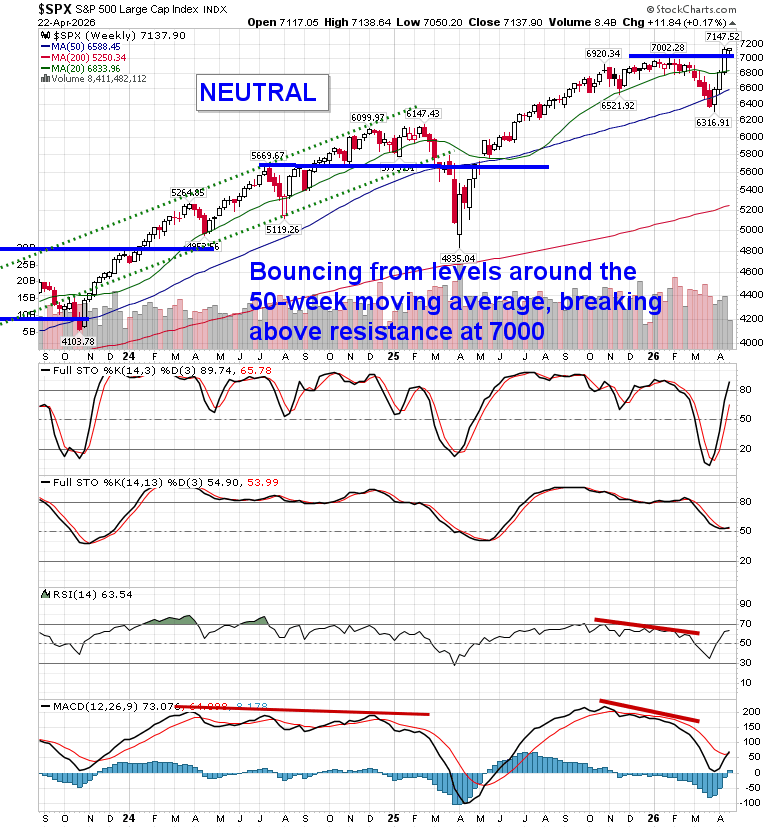
An extension of the US ceasefire with Iran (even as doubts linger as to the stability of the conflict) sent stocks higher on Wednesday, alongside a jump in the price of Oil. The S&P 500 Index added just over one percent, jumping from Friday’s gap between 7043 and 7075 and remaining elevated above the previous peak that was charted in January around 7,000. A number of other gaps remain unfilled below, including the big one between 6620 and 6740, but, ultimately, the character of the market has changed where levels of resistance hold less weight than levels of support. A break below Friday’s span of support would open the door to the gap between 6885 and 6905 that was opened a week ago Tuesday. Momentum indicators have been rolling over from overbought territory, highlighting the upside exhaustion that we had been noting in recent days. In the Seasonal Advantage Portfolio (which is strongly higher YTD, continuing to set new high watermarks) that we manage for clients at CastleMoore, we continue to be fully exposed to risk (stocks) after flipping from our low volatility stance around the end of March and our performance is benefitting. The conflict in Iran remains a wildcard and we are running down our cues that would warrant a more defensive posture in risk assets. While we do not have the signals to sell equity exposure, some portfolio hedges here are probably prudent and we implemented some of those during the Wednesday session, based on what we reported on in our last Market Outlook. Subscribers can view the themes in our chart books to either Accumulate or Avoid that we continue to gear portfolios towards.
Today, in our Market Outlook to subscribers, we discuss the following:
- Market Trend: Still Bullish, But Showing Fatigue
- Short-Covering & Meme Frenzy Driving the Rally
- Oil’s Influence is Shifting—but Still Critical
- Portfolio Positioning: Stay Invested, Add Hedges
- Key Risk: Geopolitics + Complacency
Subscribers can look for this report in their inbox or by clicking on the following link and logging in: Market Outlook for April 23
Not signed up yet? Subscribe now to receive full access to all of the research and analysis that we publish
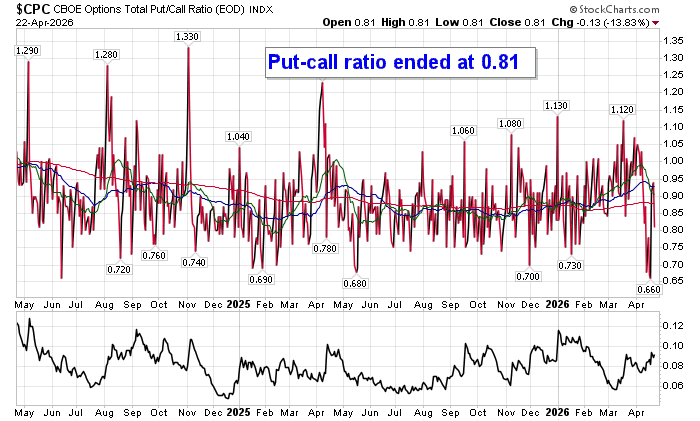
Sentiment on Wednesday, as gauged by the put-call ratio, ended bullish at 0.81.
Seasonal charts of companies reporting earnings today:


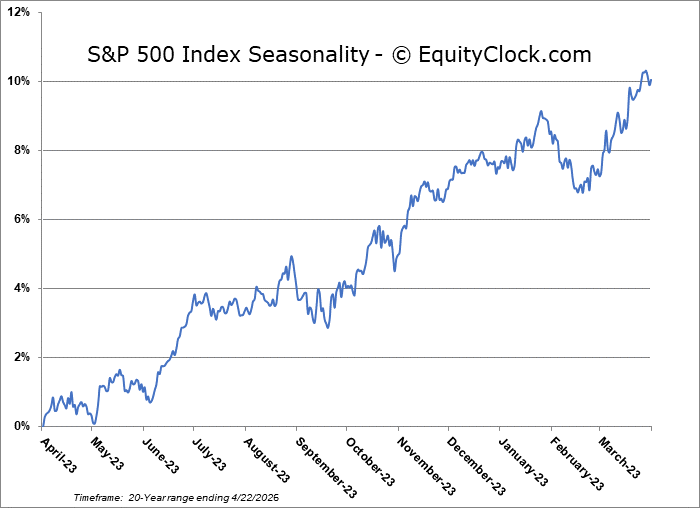
S&P 500 Index
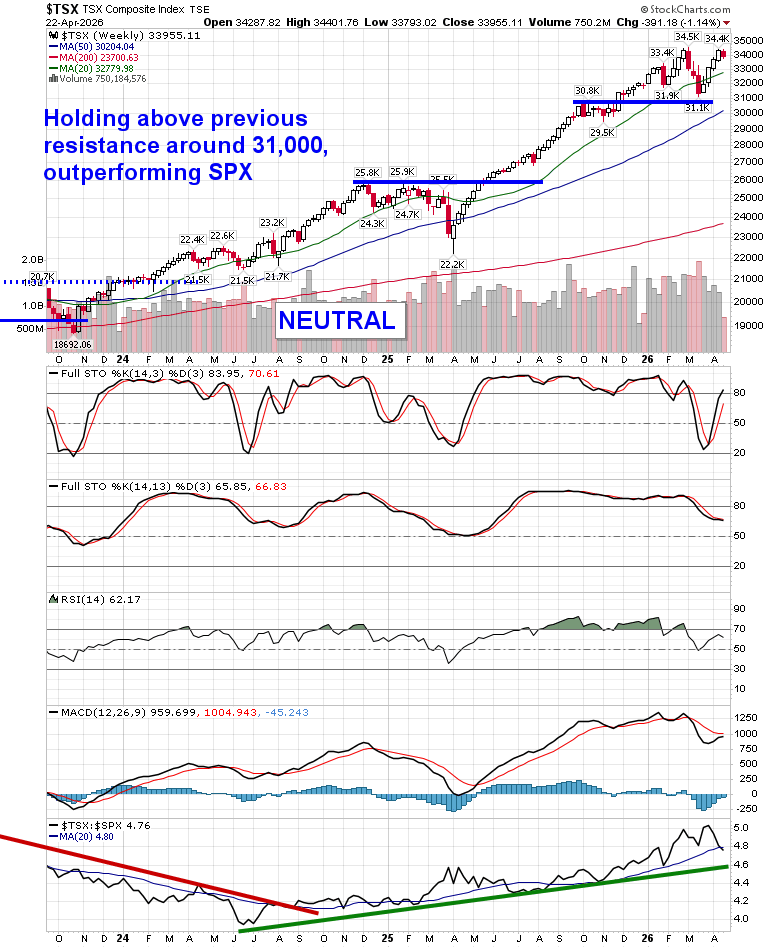
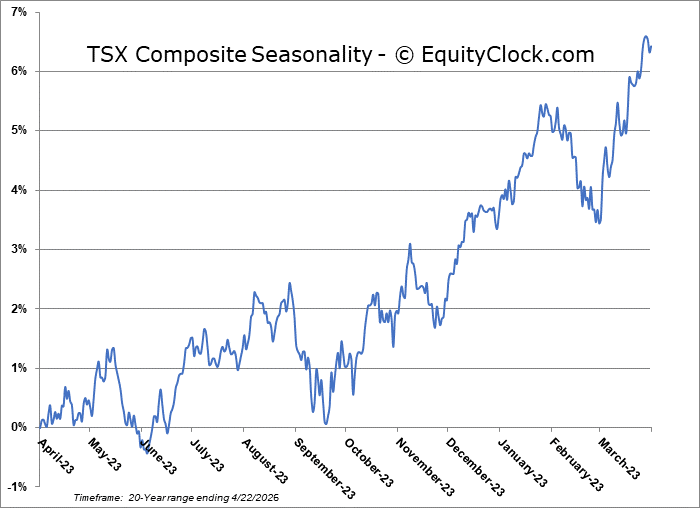
TSE Composite
| Sponsored By... |

|


